SANTA MONICA, Calif. — With more budget-conscious shoppers and the CARS "hangover" still lingering, there was a heavier dose of incentives than usual during August, according to Edmunds.com.
Specifically, automakers placed an average of $2,681 in incentives on each vehicle they sold during the month, marking a 3-percent slide from July, but a 9.2-percent hike from August 2009 when CARS was drawing to a close, Auto Remarketing reported.
"Historically, August incentives are lower than in July because there is less old-model-year inventory to sell at year-end closeout sale prices," explained Jessica Caldwell, Edmunds.com senior analyst.
"However, this year many automakers are more generous than usual, supporting the bargain-hunting mentality that is driving most car purchases these days and making up for the 'Cash for Clunkers' hangover," she continued. "Meanwhile, inventory is at a remarkably low level: It now takes about 50 days to sell the average vehicle after it arrives at a dealership, where last summer it took more than 70 days to turn."
That said, some OEMs are scaling back on incentives and employing a strategy of selling less, but spending less.
"It appears that some automakers are willing to sell fewer cars while spending less on incentives, thus make more profit per vehicle sold — a sound strategy really," Michelle Krebs, senior analyst for Edmunds.com, pointed out on AutoObserver.com.
"They are learning to live on less — at least in terms of volume — as all Americans are," she added.
Of the six largest OEMs, General Motors had the highest average spending at $3,738 per vehicle sold, which was down from $4,185 in July, but up from $3,237 a year ago.
Chrysler was second. It clipped its incentive spending down to $3,216 per vehicle sold from the $3,391 in August 2009. However, its August average was greater than its July average of $3,132.
Ford spent $3,127 per vehicle sold, up from $3,111 in July and $3,152 in August 2009.
Nissan posted a record incentive spending average in August of $2,959, which was just slightly higher than the month-ago figure ($2,957) and up from $2,557 a year ago.
Toyota's incentive spending averaged $2,180 per vehicle sold, versus $2,234 last month and $1,622 in the same period of 2009. Honda averaged $1,708 for incentive spending, compared with $1,736 in July and $898 a year ago.
Combined, the Big 3 spent an average of $3,405 on incentives per vehicle sold, compared with $3,589 the previous month. Incentive spending for European OEMs was lifted to $2,643, up from $2,456 in July.
Japanese brands spent an average of $2,083 per vehicle sold, down from $2,127 from the prior month.
Korean brands' spending averaged $1,819 during July, compared with $1,907 the month before.
Continuing on, Edmunds.com estimated that there was roughly $2.76 billion that the industry combined to spend on incentives for the month. This marked a 4.7-percent decline from July's aggregate amount.
Of August's aggregate amount, $1.5 billion was from Big 3 automakers, which combined spent 55 percent of the industry aggregate.
Japanese automakers commanded a 30.6-percent share as they put a total of $845 million toward incentives. Incentive spending for European OEMs hit $238 million for an 8.6 percent share. Korean automakers represented 5.7 percent of the aggregate as their spending totaled $158 million.
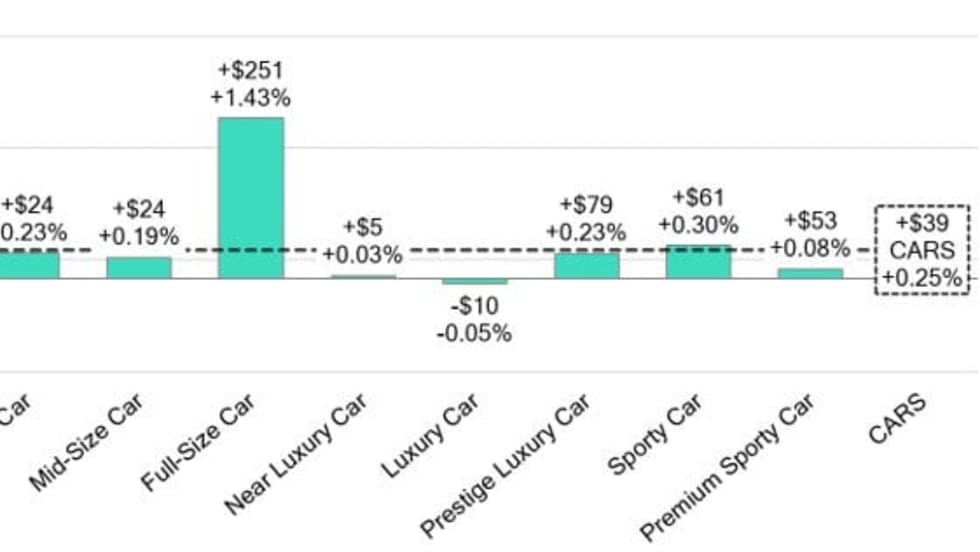
Breaking it down by vehicle category, the segment with the heaviest average spending was the premium sports cars category, which averaged $8,221 per vehicle sold. Second from the top were large trucks ($4,359).
Conversely, automakers spent the least amount, on average, on subcompact cars ($1,215). Second from the bottom were sports cars ($1,422).
When looking at incentive spending proportionately to sticker price, the heaviest category was the large car segment (12.9 percent). Large trucks were No. 2 (11.8 percent).
Meanwhile, the slightest average was in the premium luxury car segment (3.4 percent). Sports cars were next (3.9 percent).
Among brands, Lincoln had the greatest average incentive spending ($4,832) with Saab next ($4,790). Scion was at the bottom ($497) and smart was second from the bottom ($502).
Based on sticker price proportion, Mercury was tops (14.8 percent) and Chrysler was second (13.5 percent). Subaru ranked lowest (2 percent) and Porsche was next (2.7 percent).