Earnings Curves: Matching Premium with Losses…and Refunds?


Earnings Curves: Matching Premium with Losses…and Refunds?
With vehicle service contracts (VSCs) extending coverage over multiple years and premiums collected at the beginning of the contract, it is extremely important to have a benchmark to assess the profitability of the contracts that have been issued. Recognizing profitability (or lack thereof) early in the life of the contracts will assist a company in making sound financial decisions and can help keep profitability or adverse selection problems from getting worse. This article will assist readers in understanding the importance of earnings curves and the careful consideration that should be involved in deciding how to recognize revenue over the life of a service contract. We will focus on VSCs but the methodology could extend to other types of service contracts or long durational contracts where the exposure to loss may vary throughout the term of the contract.
Current Approaches
Earnings curves provide a company with the percentage of premium that should be recognized as revenue at each point throughout the life of a VSC in order to appropriately match revenue with expected VSC liabilities. Simplistic approaches commonly used, especially for financial reporting purposes, are Pro Rata, Rule of 78s and Reverse Rule of 78s. Pro Rata earns premium evenly over the life of a contract, which assumes that losses are expected to occur evenly throughout the term of the contract and does not reflect important factors such as the underlying manufacturer’s warranty or that a vehicle may exceed the VSC’s mileage term before it exceeds the time term. The Rule of 78s method of earning premium is commonly used as a benchmark when losses are expected to be weighted toward the beginning of a contract such as with Used vehicles or Guaranteed Asset Protection (GAP) coverage. The Reverse Rule of 78s is commonly used as a benchmark to earn premium for VSCs on New vehicles where the exposure is weighted toward the end of the contract after the manufacturer’s warranty has expired. In general, these benchmark curves have the benefit of being easy to calculate and understand but rarely provide an accurate expectation of the VSC liabilities throughout the term.
Ideally, earnings curves are based on an individual company’s historical experience and reflect the underlying characteristics of a particular block of contracts. Where credible data is present, earnings curves reflect the expected loss emergence pattern of a certain type of contract. The earnings patterns are typically determined by the company’s actuary based on the loss development factors obtained from actuarial loss development triangles.
Earnings curves typically state the earned percentage of premium for each month of age and vary by vehicle age group (New vs. Extended Eligibility vs. Used) and time term length. Companies with more refined methodologies and credible experience may have earnings curves that vary by a number of other factors including, but not limited to, product type, coverage level, manufacturer’s warranty term, beginning vehicle mileage, term mileage and distribution channel (dealer, internet, telemarketed, etc.).
The standard earned premium calculation in the service contract industry is as follows:
Earned Premium = [Written Premium on non-cancelled contracts * Earned %]
+ Written Premium Net of Refunds on cancelled contracts
where Earned % = 1 / Cumulative Loss Development Factor
The above approach utilizes the expected loss emergence patterns based on historical loss experience. However, the earned premium for cancelled contracts is equal to the retained portion of premium not refunded, which is independent of the selected earnings pattern. This can result in misleading calculated earned loss ratios.
Impact of Cancellations
Upon cancellation, VSCs typically refund the Pro Rata unearned premium based on time or miles, whichever is less. VSCs purchased on new vehicles have significantly lower exposure to loss during the manufacturer’s warranty and losses tend to be weighted toward the end of the contract. Therefore, upon cancellation, a New VSC may experience a significant increase in earned premium. Conversely, for used vehicles, where losses are weighted toward the beginning of a contract, the VSC may experience a significant decrease in earned premium upon cancellation. In other words, the change in earned premium due to the cancellation is negative. As the gap between the refund provision and the loss emergence pattern grows, so does the impact to earned premium at the time of cancellation.
As a result, the application of earnings factors developed solely on loss emergence patterns to premium amounts will likely produce inconsistent earned loss ratios throughout terms of the contracts, i.e., the ultimate profit will not be recognized in proportion to exposure over the terms of the contracts. Assuming the loss emergence pattern was known, using the known loss emergence pattern to earn premium will still lead to increasing loss ratios over the contract terms for Used VSCs and decreasing loss ratios over the contract terms for New VSCs as the loss and refund emergence patters ultimately converge.
To properly assess profitability, the company’s actuary must not only derive earnings curves from the loss emergence patterns but also project refund patterns to properly adjust those earnings curves to yield more accurate and more stable loss ratios.
The following graph provides an example of the impact cancellations can have on the earned loss ratio for a block of used, three year term, telemarketed VSCs evaluated at each 3 month interval.
*Note the amounts provided in the graph above were developed for illustrative purposes only and should not be relied upon.
In the example above, the earned loss ratio (utilizing an earnings curve based on loss emergence only) increases from 45% to 80% over the life of the contracts. Since the earned loss ratio increases over time, the implication is that the earnings pattern is too “fast” or too much premium was earned early in the contract term. Based on the loss and refund emergence patterns underlying this projection, an adjusted earnings curve can be derived which produces much more stable loss ratios. This adjusted earnings curve is applied to the active contracts only, just as in the formula previously stated. The effect of this adjusted curve is illustrated in the following graph:
*Note the amounts provided in the graph above were developed for illustrative purposes only and should not be relied upon.
Under both scenarios the loss emergence (green line) and earned premium associated with cancelled contracts (blue bars) are the same. The only difference is the amount of premium that is earned on active contracts (red bars) at each point in time and the resulting earned loss ratios. Since the adjusted earnings pattern accounts for both losses and cancellations, the projected earned loss ratio remains stable at 80% over the life of the contracts.
The earnings patterns utilized under both approaches are shown in the next graph. By slowing down the earnings on the active contracts, we have offset the effect that cancellations have on the earned loss ratios. As the cancellation rate increases, as is the case for direct marketed VSCs compared to dealer issued VSCs, so too will the discrepancy between an earnings curve based on loss emergence only and one which incorporates the expected refunds.
*Note the amounts provided in the graph above were developed for illustrative purposes only and should not be relied upon.
The above example represents a scenario where refunded amounts exceeded the unearned premium on cancelled contracts. A converse scenario could be imagined where refunded amounts are less than the unearned premium on cancelled contracts and a similar methodology for adjusting the earnings patterns could be utilized.
Maintenance and Monitoring
Loss and refund emergence, and therefore earnings curves, are influenced by many factors including manufacturer’s warranty terms, driving habits, economic conditions, vehicle quality, etc. There is likely constant shifting in the mix of business underlying a given earnings curve, i.e., the distribution of loss and refund dependent variables within an analyzed segment is changing. Because of this, maintenance of the earnings curves and monitoring of the loss and refund emergence patterns by the company’s actuary is required. An annual actuarial review should include an evaluation of trends in the loss and cancellation patterns and as a result, the actuary can recommend modifications to the earnings curves in an effort to achieve an appropriate balance of credibility and homogeneity.
As a final note, adjusting your earnings methodology to incorporate refunds may not produce consistent earned, ultimate and future loss ratios in the aggregate for an entire book of business. The overall earned loss ratio is driven more by shorter term business and the future loss ratio is driven more by longer term business. To the extent that differences in profitability levels exist between shorter versus longer term contracts or between issue years, the earned, ultimate and future loss ratios will likely differ.
More Actuary
The Future of Service Contract Accounting
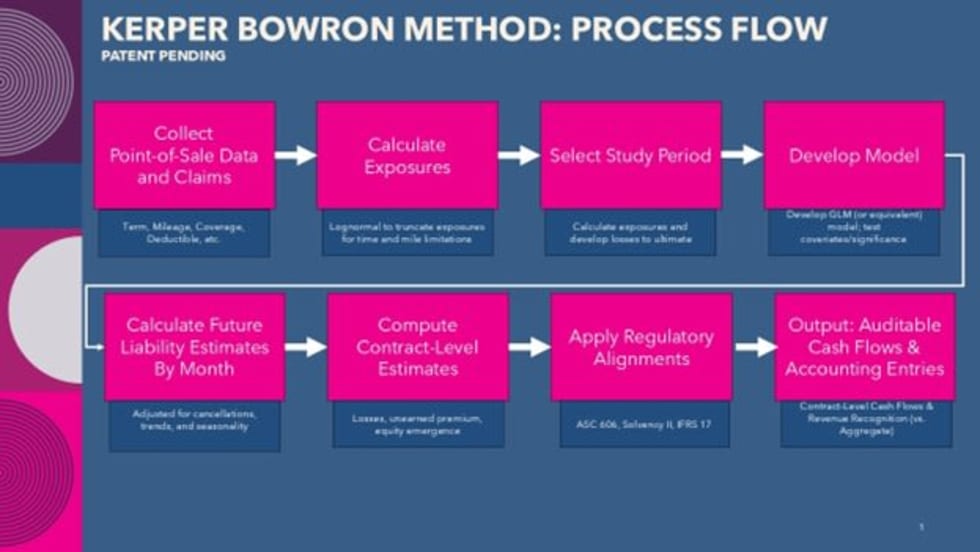
The Kerper Bowron Method is a patent-pending approach that builds on established actuarial principles but applies them at the individual contract level.
Read More →
Tougher Standards Mean Fewer IIHS Safety Awards
Fewer vehicles earned the honor in 2023 than last year as group toughens safety evaluation standards.
Read More →
Kelley Blue Book Names 2021 Best Resale Value Award Winners
An average 2021 model-year vehicle will only retain about 40% of its original value after a five-year ownership period.
Read More →
Autotrader Names 10 Best Car Interiors Under $50,000 for 2020
To help car buyers look beyond a new car’s outward appearance and focus more on the beauty within, the experts at Autotrader recently named the 10 Best Car Interiors Under $50,000 for 2020.
Read More →
Will ASC 606 Impact Me?
Released in 2014 and in effect private companies as of this year, the FASB’s ASC 606 will have a significant impact on the P&A segment. Actuarial experts break down the new standard and answer your FAQs.
Read More →
Spireon Wins IoT Breakthrough Award
Spireon’s GoldStar GPS solution earned the company Connected Car Product of the Year honors in the 2019 IoT Breakthrough Awards.
Read More →

Ziegler: They Said I Was a Crackpot
Jim Ziegler holds Uber responsible for the death of an Arizona woman who was run down by an autonomous SUV in March, but he doubts executives will face criminal charges. In They Finally Killed Somebody , the Alpha Dawg traces the so-called demand for driverless vehicles to the handful of businesses that stand to gain the most — including some of your closest partners. Click here to read the story.
Read More →
Ziegler to GMs: Don’t Sell Yourself Short
If you are an executive general manager making $500,000 a year, this video is not for you. If not, listen up, because Jim Ziegler is here to help. In an exclusive to Auto Dealer Today , the Alpha Dawg lists the 20 Things a GM Must Do Every Week to become an executive GM, take your dealership to new heights, and maximize your personal income. Click here to read the story.
Read More →