Auto Loan Default Rate Declines in October, Reports S&P/Experian

NEW YORK — The default rate for auto loans declined 1.92 percent in October, the Standard & Poor’s/Experian Consumer Credit Default Indices revealed.
The S&P/Experian indices are a comprehensive measure of changes in consumer credit defaults. With data through October 2010, the indices showed a decline in monthly default rates for all credit lines, reported F&I and Showroom magazine.
First mortgages declined in October to 2.91 percent. Bank cards decreased slightly from 7.04 percent in September to 6.91 percent in October. Second mortgages had the largest decline in defaults this month, down 16.28 percent.
"Consumer credit default rates continued their decline across all major credit sectors and among all of the cities reported here. Bringing default incidence down to more normal levels is key step to increased credit use and further improvements in the economy. However, overall credit use through September, as reported by the Federal Reserve, shows that consumers are still reining in their borrowing," says David M. Blitzer, managing director and chairman of the index committee for Standard & Poor's. "The report is encouraging – declining consumer defaults should help restore confidence and spending as we enter the holiday season."
Consumer credit defaults varied across major cities and regions of the U.S. Among the five major metropolitan statistical areas reported each month in this release, New York had the largest monthly decrease in defaults, 12.51 percent, followed by Los Angeles which declined by 8.49 percent. Miami and Chicago experienced similar declines of 7.47 percent and 7.85 percent respectively. Dallas declined slightly month over month, by 0.51 percent.
The table below gives summary results for October 2010 for the S&P/Experian Credit Default Indices. These data are not seasonally adjusted and are not subject to revision.
S&P/Experian Consumer Credit Default Indices National Indices | |||
Index | October Index Level | Change from September 2010 | Change from October 2009 |
Composite | 3.03 | -3.60% | -36.26% |
First Mortgage | 2.91 | -3.36% | -38.15% |
Second Mortgage | 1.79 | -16.28% | -48.12% |
Bank Card | 6.91 | -1.84% | -16.41% |
Auto Loans | 1.92 | -5.84% | -29.73% |
Source: S&P/Experian Consumer Credit Default Indices Data Through: October 2010 | |||
The second table below provides the S&P/Experian Consumer Default Composite Indices for five selected metropolitan statistical areas:
Metropolitan Statistical Area | October Index Level | Change from September 2010 | Change from October 2009 |
New York | 2.79 | -12.51% | -37.96% |
Chicago | 3.28 | -7.85% | -31.46% |
Dallas | 2.26 | -0.51% | -37.30% |
Los Angeles | 3.78 | -8.49% | -52.77% |
Miami | 7.03 | -7.47% | -45.65% |
Source: S&P/Experian Consumer Credit Default Indices Data Through: October 2010 | |||
More Industry
World EV Adoption Set to Grow
A new report says the segment, despite recent setbacks in some regions, is poised for acceleration as many countries look to reduce pollution.
Read More →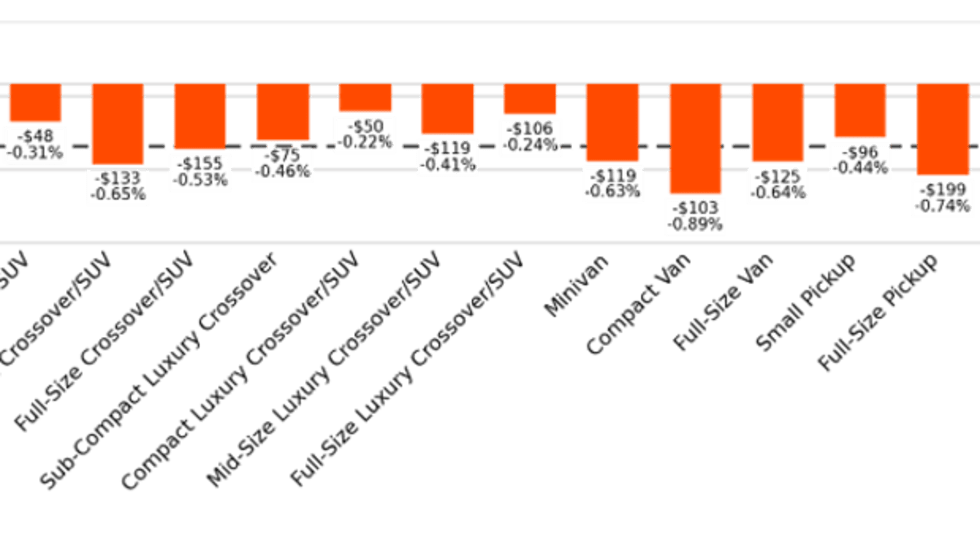
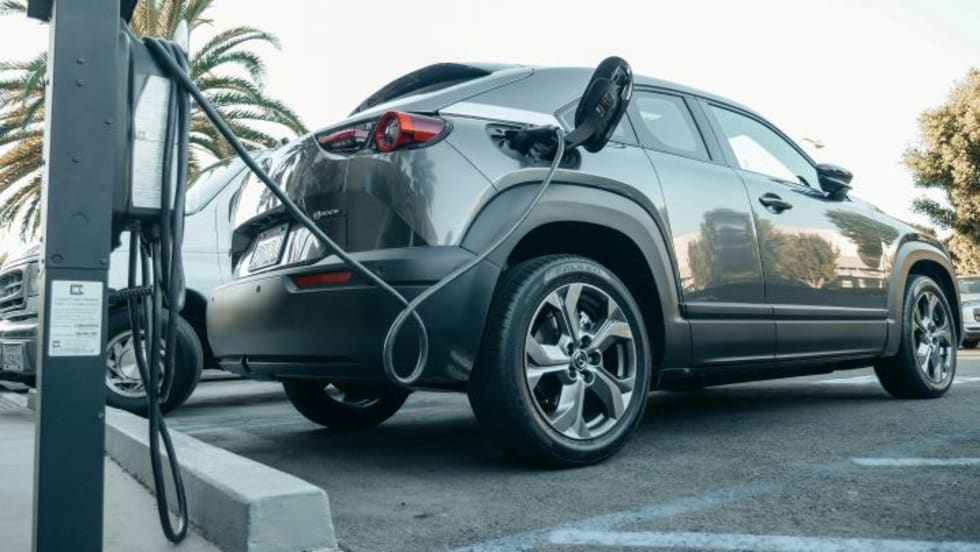
Black Book: Weekly Market Update
Wholesale automotive auction business stayed steady last week as bidders encountered lower prices, analysts observed.
Read More →
Pricing Transparency Drives Purchase Consideration
An annual study by JD Power found that clear pricing matters to consumers on automaker websites, so much so that it increases their purchase consideration.
Read More →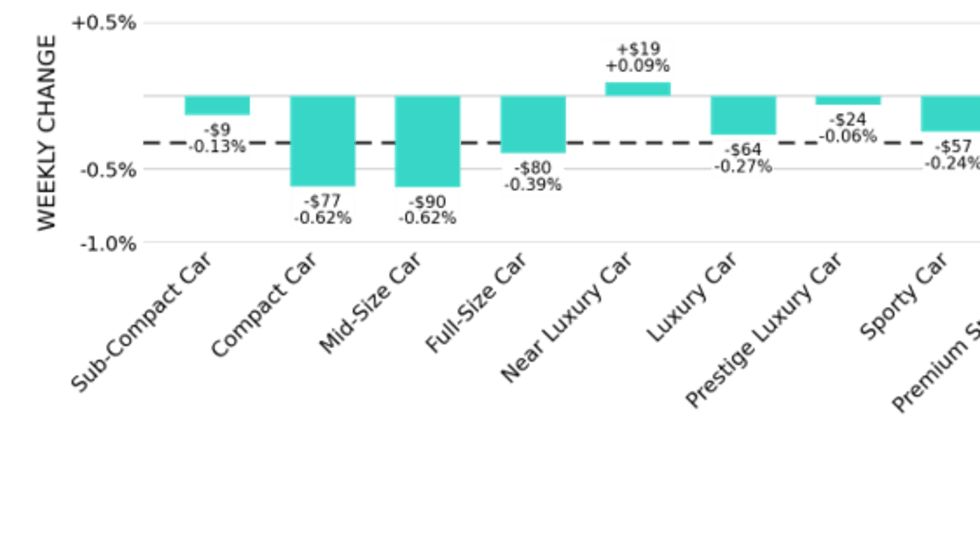
Black Book: Weekly Market Update
Used-vehicle market depreciation was the prevailing story in the wholesale market last week.
Read More →
Smaller Is Looking Better
A growing number of Americans in the market for a new vehicle are opting for more affordable options, not waiting for market stability to bite the bullet.
Read More →
U.S. EV Market Slowly Stabilizes
U.S. electric-vehicle interest is slowly stabilizing since a major dip in sales after last year's end of the federal EV tax credit, and hybrids remain the leading electrified power train.
Read More →
Global EV Market Entering New Phase
Automakers are making investments to lower battery costs and optimize production to meet changing consumer needs.
Read More →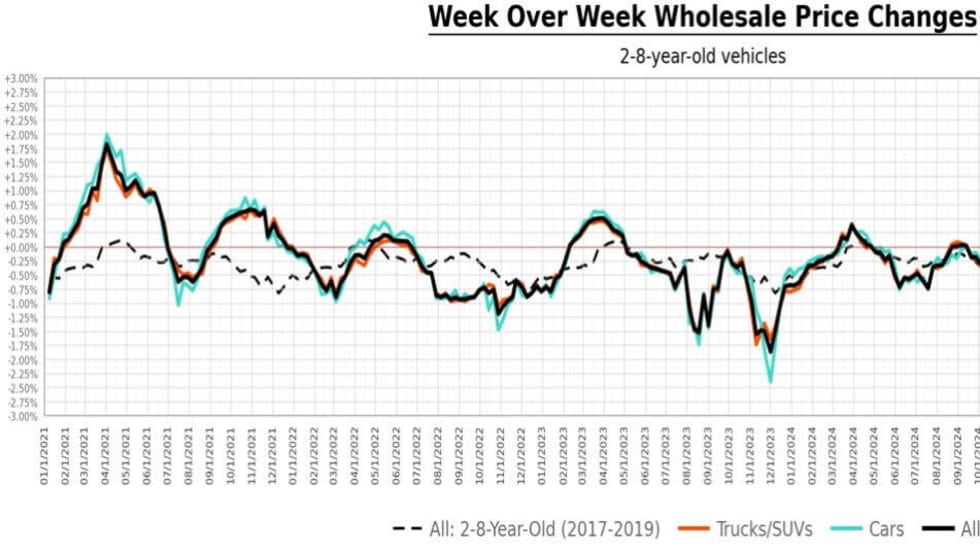
Black Book Weekly Market Update
The holiday weekend, not surprisingly, put a drag on wholesale automotive activity last week, analysts observed.
Read More →
Auto Affordability in Context
Cox Automotive points out the complex circumstances that have led to eye-popping vehicle prices.
Read More →
Black Book: Weekly Market Update
Automotive auction inventory increased last week, giving choosy bidders even more leeway.
Read More →