Providers and Administrators in blue logo
MenuMENU
SearchSEARCH

Average New-Vehicle Prices Up 4% Year-Over-Year in May 2020

According to Kelley Blue Book, incentives, inventory levels, and pickup truck market share contribute to gain; however, these levels are not sustainable.

June 2, 2020
Average New-Vehicle Prices Up 4% Year-Over-Year in May 2020

According to Kelley Blue Book, incentives, inventory levels, and pickup truck market share contribute to gain; however, these levels are not sustainable.

4 min to read


IRVINE, Calif. – The valuation analysts at Kelley Blue Book today reported the estimated average transaction price for a light vehicle in the United States was $38,940 in May 2020. New-vehicle prices increased $1,618 (up 4.3%) from May 2019, while prices dropped $244 (down 0.6%) from last month.   

Inventory levels have tightened as the economic recovery has begun, but little new supply has arrived yet from the factories that restarted in May.

Ad Loading...

“Though new-car sales will be down significantly for the third month in a row, due to the COVID-19 pandemic, average transaction prices have actually strengthened over this period for several reasons,” said Tim Fleming, analyst for Kelley Blue Book. “Incentives, deferred payments, and low APR deals are helping consumers stretch out their monthly payments over longer terms. Inventory levels have tightened as the economic recovery has begun, but little new supply has arrived yet from the factories that restarted in May. Finally, the share of pickup trucks has spiked recently, reaching an all-time high in April.”

These factors all contributed to the 4% increase in transaction prices in May 2020; however, gains at these levels are not sustainable. If factories are slow to restart and new-vehicle inventories remain low, manufacturers will pare back their incentives, placing pressure on new-vehicle prices. While trucks have been remarkably resilient, their big spike in market share was the result of sales losses in mid-size cars, compact SUVs and minivans. When the market sees sales of these family haulers return will depend on the shape of the economic recovery, but in the meantime, truck manufacturers are likely pushing to get capacity back up quickly to restock their inventories.

Manufacturer

May

2020

Transaction Price (Avg.)*

April

2020

Transaction Price (Avg.)*

May

2019 Transaction Price (Avg.)*

Percent Change April 2020 to May 2020*

Percent Change May

2019 to

May

2020*

American Honda (Acura, Honda)

$29,155

$29,206

$28,542

-0.2%

2.1%

FiatChrysler (Alfa Romeo, Chrysler, Dodge, Fiat, Jeep, RAM)

$43,592

$44,810

$40,525

-2.7%

7.6%

Ford Motor Company (Ford, Lincoln)

$43,847

$44,318

$41,888

-1.1%

4.7%

General Motors (Buick, Cadillac, Chevrolet, GMC)

$43,806

$43,621

$42,339

0.4%

3.5%

HyundaiKia

$28,339

$28,232

$26,674

0.4%

6.2%

Nissan North America (Nissan, INFINITI)

$31,881

$32,221

$29,743

-1.1%

7.2%

Subaru

$31,301

$31,433

$30,102

-0.4%

4.0%

Toyota Motor Company (Lexus, Toyota)

$35,218

$35,220

$33,432

0.0%

5.3%

Volkswagen Group (Audi, Volkswagen, Porsche)

$40,698

$40,576

$43,649

0.3%

-6.8%

Industry

$38,940

$39,184

$37,322

-0.6%

4.3%

*Kelley Blue Book average transaction prices do not include applied consumer incentives

Fiat Chrysler led all automakers in May with average prices rising more than 7%. Much of the improvement is attributed to RAM, which has been capturing a growing share of the full-size truck market. In addition, Jeep rose by 5%, thanks largely to the Gladiator. Even though the Gladiator’s prices were down significantly from its launch last year, it still carries an average price premium of about $7,500 over the next closest competitor in the mid-size truck segment. The Dodge brand also showed big improvements of about 10% as Caravan sales fell, while its remaining models showed improvements in the 2 to 3% range.

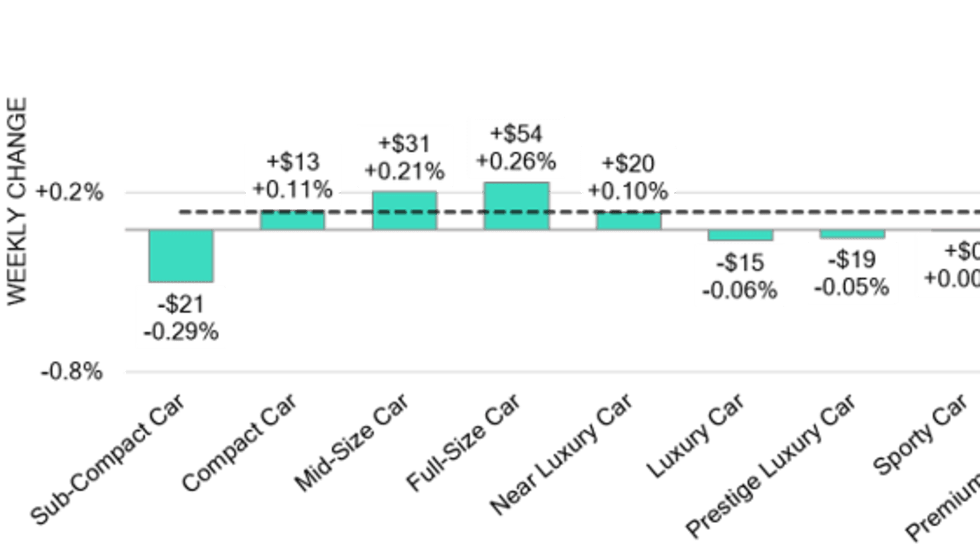
For the second month in a row, prices for cars moved up the most and averaged more than 3% improvement. Solid gains were seen across all non-luxury car segments with subcompact cars gaining the most at 4%, led by the Nissan Versa. In contrast, luxury segments suffered again, making up four of the five segments with year-over-year price declines. Overall, the luxury market saw prices fall slightly while non-luxury brands saw prices rise upwards 5%. The large gains come mostly from the surge in trucks, which have seen a massive increase in share over the past couple of months.


Segment


May

2020

Transaction Price (Avg.)*

April

2020

Transaction Price (Avg.)*

May

2019 Transaction Price (Avg.)*

Percent Change April 2020 to May 2020*

Percent Change May

2019 to

May

2020*

Compact Car

$21,462

$21,364

$20,850

0.5%

2.9%

Compact SUV/Crossover

$30,108

$29,975

$29,472

0.4%

2.2%

Electric Vehicle

$47,975

$49,255

$48,568

-2.6%

-1.2%

Entry-level Luxury Car

$42,380

$42,163

$42,925

0.5%

-1.3%

Full-size Car

$36,481

$36,255

$35,521

0.6%

2.7%

Full-size Pickup Truck

$51,240

$50,980

$50,592

0.5%

1.3%

Full-Size SUV/Crossover

$62,868

$62,535

$62,296

0.5%

0.9%

High Performance Car

$109,885

$112,781

$105,732

-2.6%

3.9%

High-end Luxury Car

$97,979

$96,000

$99,523

2.1%

-1.6%

Hybrid/Alternative Energy Car

$27,412

$27,465

$27,346

-0.2%

0.2%

Luxury Car

$60,473

$60,697

$60,274

-0.4%

0.3%

Luxury Compact SUV/Crossover

$46,755

$46,756

$46,475

0.0%

0.6%

Luxury Full-size SUV/Crossover

$86,243

$85,926

$88,277

0.4%

-2.3%

Luxury Mid-size SUV/Crossover

$57,720

$58,438

$59,676

-1.2%

-3.3%

Luxury Subcompact SUV/Crossover

$39,632

$39,143

$39,222

1.2%

1.0%

Mid-size Car

$26,444

$26,282

$25,773

0.6%

2.6%

Mid-size Pickup Truck

$36,481

$36,365

$35,425

0.3%

3.0%

Mid-size SUV/Crossover

$40,424

$40,587

$38,792

-0.4%

4.2%

Minivan

$36,172

$36,582

$34,716

-1.1%

4.2%

Sports Car

$36,879

$36,862

$36,312

0.0%

1.6%

Subcompact Car

$17,275

$17,092

$16,587

1.1%

4.1%

Subcompact SUV/Crossover

$24,824

$24,748

$24,629

0.3%

0.8%

Van

$36,448

$36,508

$35,677

-0.2%

2.2%

Grand Total

$38,940

$39,184

$37,322

-0.6%

4.3%

*Kelley Blue Book average transaction prices do not include applied consumer incentives

Read: Momentum CRM Announces Integration With automotiveMastermind’s Market EyeQ Platform

Topics:Industry

Originally posted on F&I and Showroom

More Industry

Photo of the rear of a new BMW iX SUV
Industryby Hannah MitchellMay 12, 2026

New-Vehicle Prices Rise

With April sales down, higher prices on in-demand large vehicles helped inflate the overall ATP, though increases were under long-term averages, Cox Automotive reported.

Read More →
Graphic of car segments' results the previous week
Industryby StaffMay 12, 2026

Black Book: Weekly Market Update

Last week in the wholesale automotive market proved to be a mixed bag, analysts reported.

Read More →
Graphic of last week's estimated used retail days to turn
Industryby StaffMay 6, 2026

Black Book: Weekly Market Update

Conversion rates were flat last week at 63%, Black Book analysts calculated, as low-mileage and almost-near units outpaced the overall market.

Read More →
Ad Loading...
cargo ship with vehicles, at dock
Industryby Lauren LawrenceMay 5, 2026

EU Auto Association Urges Action

Trade relations between the European Union and the U.S. are at risk, causing the European Automobile Manufacturers Association to push lawmakers to make a decision.

Read More →
two people working on a paper contract together
IndustryMay 1, 2026

Driving into the Super CFC Era

Understanding the risks and benefits of retail accounting and Super CFCs can help you better present options to your dealer partners.

Read More →
Photo of outdoor electric-vehicle charger
Industryby Hannah MitchellApril 28, 2026

Global Roads Getting More Electric

China easily reigns in the segment, but European countries’ adoption rates are growing. The U.S., probably due to market size, has the second biggest EV fleet.

Read More →
Ad Loading...
Graphic of wholesale weekly price index
Industryby StaffApril 28, 2026

Black Book: Weekly Market Update

The full-size pickup segment, which has been dominant in the U.S., ended 11 consecutive weeks of gains with a slight dip last week.

Read More →
Line graphic showing week-over-week wholesale auto price changes
Industryby StaffApril 22, 2026

Black Book: Weekly Market Update

Wholesale auto conversion rates dropped slightly as auction buyers proved picky last week, analysts observed.

Read More →
pavement with car and charger wrapped around it painted on

EV Battery Cycle Life at Risk

Fast charging of electric vehicles provides a solution for range anxiety, but it also poses a risk to battery cycle life due to increased temperatures, according to an EV supply chain data provider.

Read More →
Ad Loading...
Photo of exterior facade of Beardmore Chevrolet store
Industryby Hannah MitchellApril 14, 2026

Founding Family Sells Nebraska Dealerships

Expanding Midwest automotive group picks up three stores as part of the robust transaction activity early this year.

Read More →