GM Financial reported increases in loan originations and reduced delinquencies and charge-offs, but lease originations fell $2.3 billion from the first three quarters of 2017.
FORT WORTH, Texas — General Motors Financial Company Inc. reported net income of $441 million for the quarter ended Sept. 30, 2018, compared to $442 million for the quarter ended June 30, 2018, and $202 million for the quarter ended Sept. 30, 2017. Net income for the nine months ended Sept. 30, 2018, was $1.3 billion, compared to $466 million for the nine months ended Sept. 30, 2017.
Retail loan originations were $6.7 billion for the quarter ended Sept. 30, 2018, compared to $6.0 billion for the quarter ended June 30, 2018, and $4.7 billion for the quarter ended Sept. 30, 2017. Retail loan originations for the nine months ended Sept. 30, 2018 were $17.8 billion, compared to $15.5 billion for the nine months ended Sept. 30, 2017.
Ad Loading...
The outstanding balance of retail finance receivables, net of fees, was $37.9 billion at Sept. 30, 2018. Operating lease originations were $5.4 billion for the quarter ended Sept. 30, 2018, compared to $6.2 billion for the quarter ended June 30, 2018, and $6.5 billion for the quarter ended Sept. 30, 2017.
Operating lease originations for the nine months ended Sept. 30, 2018 were $17.3 billion, compared to $19.6 billion for the nine months ended Sept. 30, 2017. Leased vehicles net was $44.1 billion at Sept. 30, 2018. The outstanding balance of commercial finance receivables, net of fees was $11.1 billion at Sept. 30, 2018, compared to $10.7 billion at June 30, 2018 and $9.5 billion at Sept. 30, 2017. Retail finance receivables 31 to 60 days delinquent were 3.4% of the portfolio at Sept. 30, 2018 and 3.6% at Sept. 30, 2017.
Accounts more than 60 days delinquent were 1.3% of the portfolio at Sept. 30, 2018 and 1.6% at Sept. 30, 2017. Annualized net charge-offs were 1.7% of average retail finance receivables for the quarter ended Sept. 30, 2018 and 1.9% for the quarter ended Sept. 30, 2017. For the nine months ended Sept. 30, 2018, annualized retail net charge-offs were 1.8%, compared to 1.9% for the nine months ended Sept. 30, 2017.
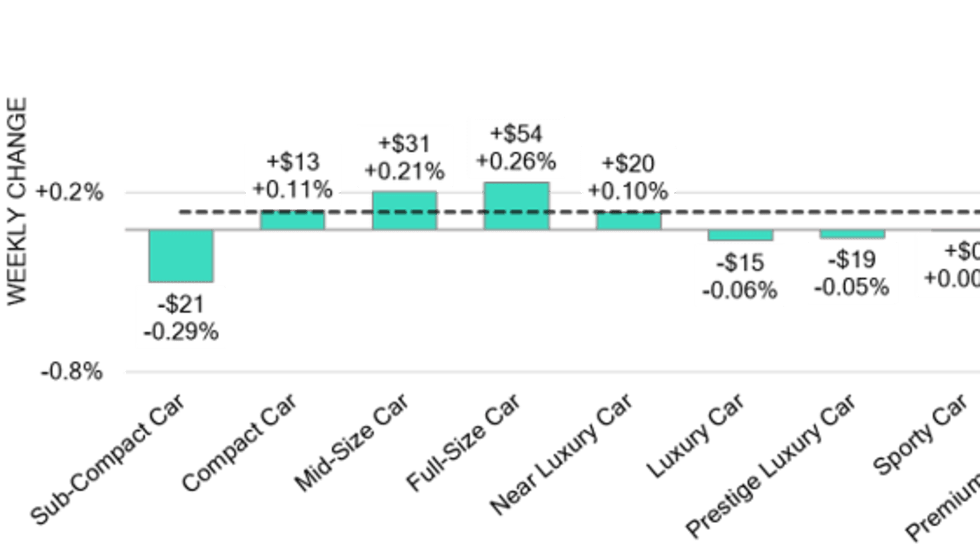
With April sales down, higher prices on in-demand large vehicles helped inflate the overall ATP, though increases were under long-term averages, Cox Automotive reported.
Trade relations between the European Union and the U.S. are at risk, causing the European Automobile Manufacturers Association to push lawmakers to make a decision.
China easily reigns in the segment, but European countries’ adoption rates are growing. The U.S., probably due to market size, has the second biggest EV fleet.
Fast charging of electric vehicles provides a solution for range anxiety, but it also poses a risk to battery cycle life due to increased temperatures, according to an EV supply chain data provider.