


New-Vehicle Prices Set Record in July 2022, as Inventory Improves Year-Over-Year and Luxury Share Remains Elevated
According to Kelley Blue Book, new-vehicle buyers remain in an “over sticker” market, paying above MSRP every month this year.


According to Kelley Blue Book, new-vehicle buyers remain in an “over sticker” market, paying above MSRP every month this year.
ATLANTA – The average price paid for a new vehicle in the U.S. in July 2022 topped June’s record and kept the average transaction price (ATP) solidly above the $48,000 mark, according to new data released today by Kelley Blue Book, a Cox Automotive brand.
The Kelley Blue Book new-vehicle ATP increased to $48,182 in July 2022, beating the previous high of $48,043 set last month. July prices rose 0.3% ($139) from June 2022 and 11.9% ($5,126) from July 2021.
New-vehicle inventory days’ supply held steady in the mid-30s in July, where it has been consistently since the final months of 2021. Surprisingly, days’ supply the end of July was 27% higher than it was in 2021, when inventory shortages first started to impact the market, demand was even higher, and days’ supply dropped into the 20s. Still, with roughly 1.1 million units in inventory in the U.S., new-vehicle inventory remains significantly below levels seen in 2020 and 2019.
With tight inventory and sufficient demand, transaction prices remain elevated. Most dealers continue to sell vehicles above the manufacturer’s suggested retail price (MSRP). Honda, Kia, Land Rover, and Hyundai continue to show the most price strength in the market, transacting between 5% to 8% over sticker last month. Ram, Volvo, Lincoln, Buick, and the smaller Italian brands, Alfa Romeo and Fiat, showed the least price strength last month, selling 1% or more below MSRP.
“It’s still a sellers’ market,” said Rebecca Rydzewski, research manager of economic and industry insights for Cox Automotive. “New-vehicle inventory levels are better than a year ago, but remain historically low, and that’s keeping new-vehicle prices elevated. Still, even though average prices are at a record level, there are affordable vehicles out there. Compact cars and SUVs and subcompact models typically transact for 30% to 40% below the industry average.”
The average price paid for a new non-luxury vehicle last month was $44,431, up $363 from June, and a new record for non-luxury vehicles, beating out the high set the prior month. Car shoppers in the non-luxury segment paid on average $875 above sticker price, a decrease from the prior month. Still, shoppers are paying more than they did compared to a year ago when they paid 0.8% below MSRP.
In July, the average luxury buyer paid $65,530 for a new vehicle, down $382 from last month, when luxury ATPs hit a record $65,912. Luxury buyers continue to pay more than MSRP for new vehicles, although prices are trending closer sticker prices. For comparison, luxury vehicles were selling for $386 under MSRP one year ago. Luxury vehicle share remains historically high, pushing the overall industry ATP higher, but decreased to 17.8% of total sales in July from 18.2% in June.
The average price paid for a new electric vehicle (EV) dropped in July by 2.3% compared to June but increased by 18.8% versus a year ago. The average price for a new electric vehicle – over $66,000, according to Kelley Blue Book estimates – remains well above the industry average and more aligned with luxury prices versus mainstream prices.
Incentives increased slightly in July versus June, but remain low, at only 2.4% of the average transaction price. A year ago, incentives averaged 5.9% of ATP. Full-size cars and luxury cars had the highest incentives in July, while high-performance cars, full-size luxury SUVs, and electric vehicles had the lowest incentives.
Manufacturer
July 2022 Transaction Price (Avg)*
June 2022 Transaction Price (Avg)*
July 2021 Transaction Price (Avg)*
Month-Over-Month Percent Change
Year-Over-Year Percent Change
BMW
$64,723
$65,785
$57,517
-1.6%
12.5%
Daimler
$67,558
$67,619
$73,089
-0.1%
-7.6%
Ford Motor Company
$54,523
$54,374
$52,289
0.3%
4.3%
Geely Auto Group
$58,422
$59,575
$53,841
-1.9%
8.5%
General Motors
$51,193
$50,289
$49,337
1.8%
3.8%
Honda Motor Company
$39,502
$38,454
$33,776
2.7%
17.0%
Hyundai Motor Group
$36,257
$36,741
$32,428
-1.3%
11.8%
Mazda Motor Corporation
$34,326
$33,813
$32,542
1.5%
5.5%
Renault-Nissan-Mitsubishi Alliance
$35,652
$35,462
$32,547
0.5%
9.5%
Rivian
$77,111
$76,803
0.4%
Stellantis
$55,251
$53,994
$48,998
2.3%
12.8%
Subaru Corporation
$35,372
$36,333
$34,536
-2.6%
2.4%
Tata Motors
$86,386
$84,264
$80,846
2.5%
6.9%
Tesla Motors
$69,255
$70,488
$57,479
-1.8%
20.5%
Toyota Motor Corporation
$40,539
$40,027
$38,284
1.3%
5.9%
Volkswagen Group
$52,752
$56,736
$49,105
-7.0%
7.4%
Industry
$48,182
$48,042
$43,056
0.3%
11.9%
*Kelley Blue Book average transaction prices do not include all applied consumer incentives
Make
July 2022 Transaction Price (Avg)*
June 2022 Transaction Price (Avg)*
July 2021 Transaction Price (Avg)*
Month-Over-Month Percent Change
Year-Over-Year Percent Change
Acura
$52,879
$53,191
$45,725
-0.6%
15.6%
Alfa Romeo
$53,040
$52,848
$48,626
0.4%
9.1%
Audi
$61,398
$62,943
$59,689
-2.5%
2.9%
BMW
$67,770
$68,266
$59,926
-0.7%
13.1%
Buick
$38,214
$37,131
$36,111
2.9%
5.8%
Cadillac
$70,603
$70,205
$75,424
0.6%
-6.4%
Chevrolet
$47,945
$46,687
$46,215
2.7%
3.7%
Chrysler
$48,384
$47,758
$42,710
1.3%
13.3%
Dodge
$48,029
$45,505
$44,375
5.6%
8.2%
Fiat
$28,153
$30,401
$28,706
-7.4%
-1.9%
Ford
$53,991
$53,685
$51,762
0.6%
4.3%
Genesis
$60,573
$60,172
$60,043
0.7%
0.9%
GMC
$58,368
$58,516
$56,911
-0.3%
2.6%
Honda
$38,255
$36,796
$32,306
4.0%
18.4%
Hyundai
$34,474
$35,690
$31,362
-3.4%
9.9%
Infiniti
$59,383
$59,021
$52,234
0.6%
13.7%
Jaguar
$74,128
$74,250
$67,993
-0.2%
9.0%
Jeep
$53,680
$52,463
$46,035
2.3%
16.6%
Kia
$35,962
$36,137
$31,429
-0.5%
14.4%
Land Rover
$88,709
$86,083
$83,358
3.1%
6.4%
Lexus
$55,801
$55,892
$51,315
-0.2%
8.7%
Lincoln
$66,406
$68,803
$66,555
-3.5%
-0.2%
Mazda
$34,326
$33,813
$32,542
1.5%
5.5%
Mercedes-Benz
$67,558
$67,619
$73,089
-0.1%
-7.6%
Mini
$36,705
$37,287
$35,743
-1.6%
2.7%
Mitsubishi
$31,489
$30,685
$27,074
2.6%
16.3%
Nissan
$34,356
$34,681
$32,110
-0.9%
7.0%
Polestar
$58,778
$58,759
62300
0.0%
-5.7%
Porsche
$117,122
$116,450
$98,517
0.6%
18.9%
Ram
$60,992
$59,704
$55,399
2.2%
10.1%
Rivian
$77,111
$76,803
0.4%
Subaru
$35,372
$36,333
$34,536
-2.6%
2.4%
Tesla
$69,255
$70,488
$57,479
-1.8%
20.5%
Toyota
$38,144
$37,589
$36,189
1.5%
5.4%
Volkswagen
$37,782
$38,391
$34,397
-1.6%
9.8%
Volvo
$58,380
$59,647
$53,776
-2.1%
8.6%
Industry
$48,182
$48,042
$43,056
0.3%
11.9%
*Kelley Blue Book average transaction prices do not include all applied consumer incentives
Category
July 2022 Transaction Price (Avg)*
June 2022 Transaction Price (Avg)*
July 2021 Transaction Price (Avg)*
Month-Over-Month Percent Change
Year-Over-Year Percent Change
Compact Car
$26,285
$26,154
$24,057
0.5%
9.3%
Compact SUV/Crossover
$35,323
$35,372
$32,761
-0.1%
7.8%
Electric Vehicle
$66,645
$68,206
$56,110
-2.3%
18.8%
Entry-level Luxury Car
$54,350
$52,627
$47,794
3.3%
13.7%
Full-size Car
$45,999
$44,488
$42,649
3.4%
7.9%
Full-size Pickup Truck
$63,012
$62,396
$57,359
1.0%
9.9%
Full-size SUV/Crossover
$73,934
$73,037
$67,168
1.2%
10.1%
High Performance Car
$116,950
$110,453
$99,474
5.9%
17.6%
High-end Luxury Car
$119,496
$118,469
$120,484
0.9%
-0.8%
Hybrid/Alt-Energy Car
$32,365
$34,163
$31,490
-5.3%
2.8%
Luxury Car
$75,012
$73,601
$69,603
1.9%
7.8%
Luxury Compact SUV
$52,595
$53,466
$49,354
-1.6%
6.6%
Luxury Full-size SUV
$100,473
$99,541
$100,682
0.9%
-0.2%
Luxury Mid-size SUV
$68,484
$69,096
$65,331
-0.9%
4.8%
Luxury Subcompact SUV
$44,219
$44,659
$42,964
-1.0%
2.9%
Mid-size Car
$32,322
$31,677
$30,699
2.0%
5.3%
Mid-size SUV
$47,647
$47,257
$44,168
0.8%
7.9%
Minivan
$47,779
$47,399
$43,320
0.8%
10.3%
Small/Mid-size Pickup
$41,046
$40,881
$41,411
0.4%
-0.9%
Sports Car
$45,549
$45,877
$43,974
-0.7%
3.6%
Subcompact Car
$23,220
$22,754
$20,695
2.1%
12.2%
Subcompact SUV
$30,632
$30,115
$27,680
1.7%
10.7%
Van
$51,174
$50,439
$44,960
1.5%
13.8%
Industry
$48,182
$48,042
$43,056
0.3%
11.9%
*Kelley Blue Book average transaction prices do not include all applied consumer incentives
Originally posted on Auto Dealer Today
More Industry
Charger Network Growth Slows
Despite a projected increase in public EV chargers in 2026, charging infrastructure remains a top concern for consumers as the gap between the most and least EV-friendly places remains substantial.
Read More →
Lenders, Consumers Take on More Auto Loan Risk
September records loosened credit access the most in over a decade as buyers took advantage of the conditions to afford trading, though loan applications fell.
Read More →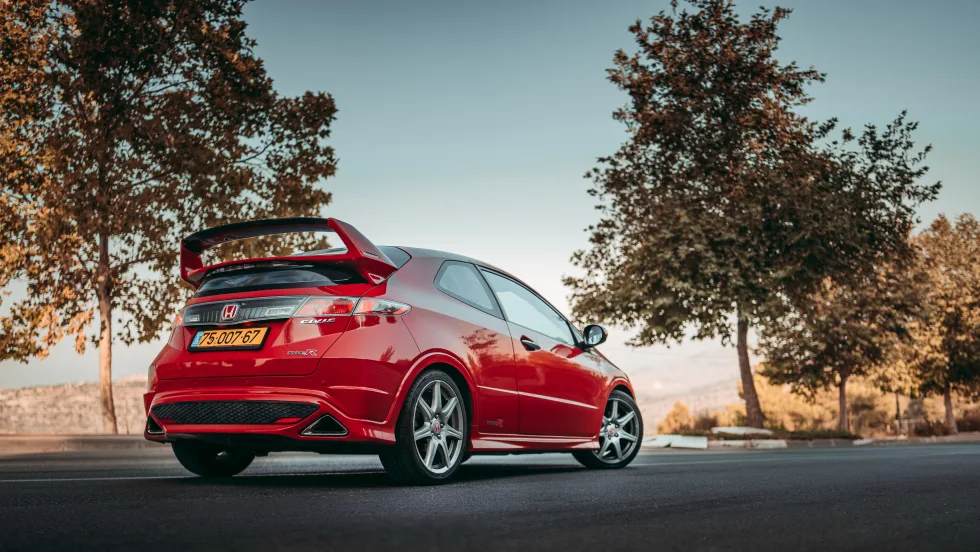
Next-Gen Hybrids in Sight
Dealerships can expect to see revamped hybrids from Honda next year as the company rolls out a new system and model lineup.
Read More →
Gem State Stores Change Hands
A larger auto group founded in the industry’s early years sold two franchises to a neighbor group that's on a growth spurt.
Read More →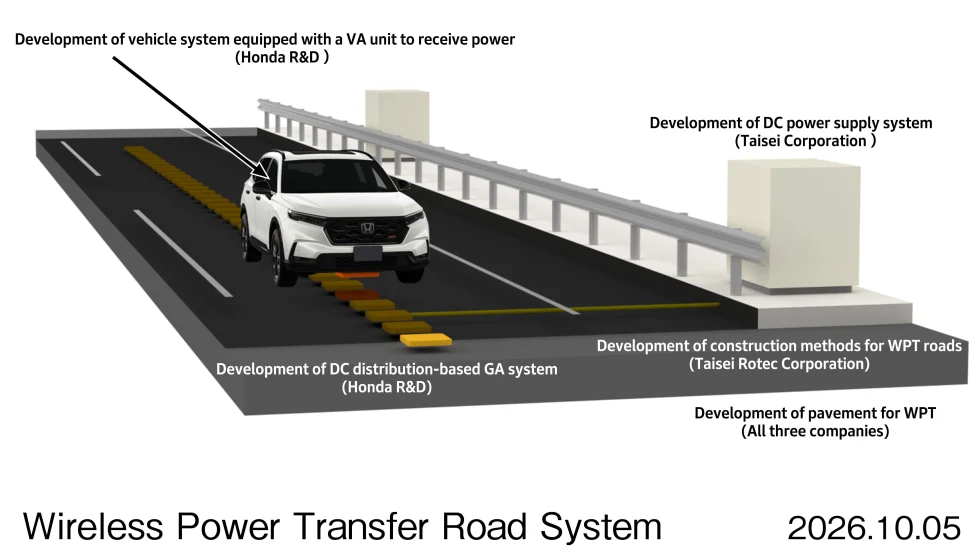
Charging In Motion
Honda has been researching wireless in-motion charging for electric vehicles since 2025, and new technology developments have put it a step closer to a final product.
Read More →
Twin Cities Stores Sell
Minnesota-based Walser Automotive Group made what it called the most significant acquisition in its history with a three-rooftop deal in Minneapolis.
Read More →
U.S. Auto Sales Still Below Prepandemic Levels
Mobility Global industry observers don’t expect the market to return to the higher volumes that became routine before Covid but to stay well below its potential.
Read More →
The Powertrain Shift
Electric-vehicle owners are backpedaling, according to new data, with product availability driving many to shift back to gas-powered engines.
Read More →
Achromatic Autos
The shades that dominate the U.S. car market don’t call attention to themselves, though grayscale may have plateaued after a 30-year upswing, research shows.
Read More →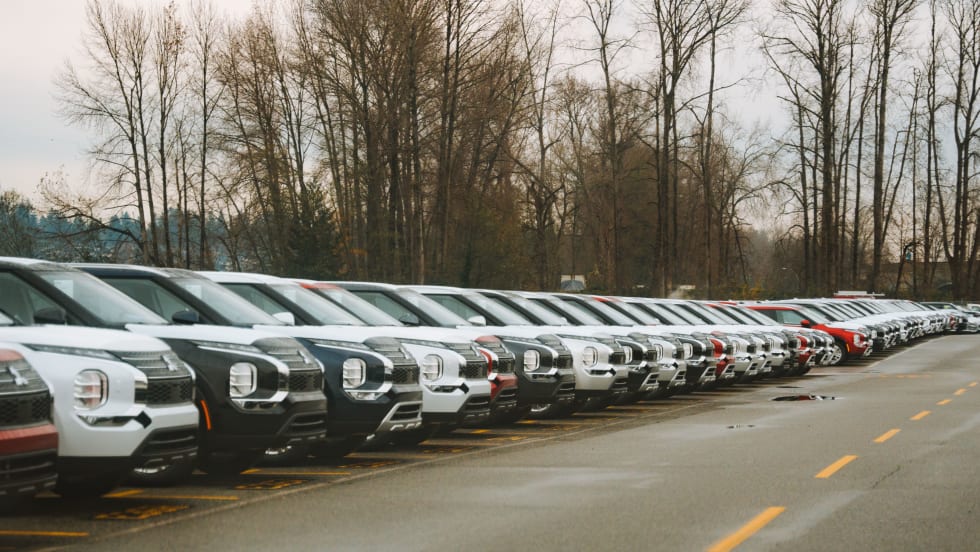
Used-Vehicle Affordability Worsens
Listing prices in August defied seasonal trends, rising above $27,000 for the second time this year.
Read More →