


Edmunds.com: Incentives Rise for 2010 Model Year Vehicles

SANTA MONICA, Calif. — Edmunds.com estimates that the average automotive manufacturer incentive in the U.S. was $2,713 per vehicle sold in November 2009, up $52, or 1.9 percent, from October 2009, and up $32, or 1.9 percent, from November 2008.
"Now that 2010 models are piling up on dealership lots, incentives on the new models are increasing, up 21 percent from last month," stated Jessica Caldwell, director of industry analysis for Edmunds.com.
Combined incentives spending for domestic manufacturers averaged $3,712 per vehicle sold in November 2009, down from $3,844 in October 2009. From October 2009 to November 2009, European automakers increased incentives spending by $200 to $3,186 per vehicle sold; Japanese automakers increased incentives spending by $117 to $1,547 per vehicle sold; and Korean automakers decreased incentives spending by $38 to $1,946 per vehicle sold.
In November 2009, the industry's aggregate incentive spending is estimated to have totaled approximately $1.92 billion, down 13.6 percent from October 2009. Chrysler, Ford and General Motors spent an aggregate of $1.2 billion, or 62.4 percent of the total; Japanese manufacturers spent $421 million, or 21.8 percent; European manufacturers spent $219 million, or 11.4 percent; and Korean manufacturers spent $84 million, or 4.4 percent.
"Not surprisingly, GM is forced to spend handsomely on incentives — using taxpayer money — to wind down the Saturn and Pontiac brands and to keep Hummer and Saab afloat," said Edmunds' AutoObserver.com Senior Editor Michelle Krebs.
Among vehicle segments, premium sport cars had the highest average incentives, $9,429 per vehicle sold, followed by large SUV at $4,974. Subcompact cars had the lowest average incentives per vehicle sold, $1,090, followed by compact cars at $1,523. Analysis of incentives expenditures as a percentage of average sticker price for each segment shows large trucks averaged the highest, 13.9 percent, followed by large SUVs at 12.3 percent of sticker price. Premium luxury cars averaged the lowest with 5.3 percent and sport cars followed with 5.6 percent of sticker price.
Comparing all brands, in November Scion spent $375 followed by smart at $586 per vehicle sold. At the other end of the spectrum, HUMMER spent the most, $5,975, followed by Cadillac at $5,787 per vehicle sold. Relative to their vehicle prices, Pontiac and Saturn spent the most, 19.2 percent and 16.8 percent of sticker price, respectively; while Scion spent 2.2 and Subaru spent 2.6 percent.
More Industry
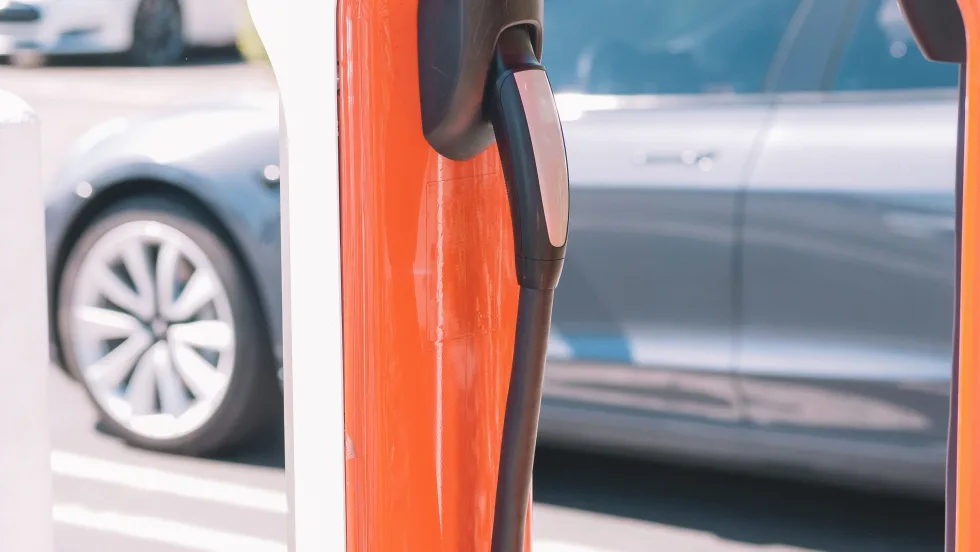
Charger Network Growth Slows
Despite a projected increase in public EV chargers in 2026, charging infrastructure remains a top concern for consumers as the gap between the most and least EV-friendly places remains substantial.
Read More →
Lenders, Consumers Take on More Auto Loan Risk
September records loosened credit access the most in over a decade as buyers took advantage of the conditions to afford trading, though loan applications fell.
Read More →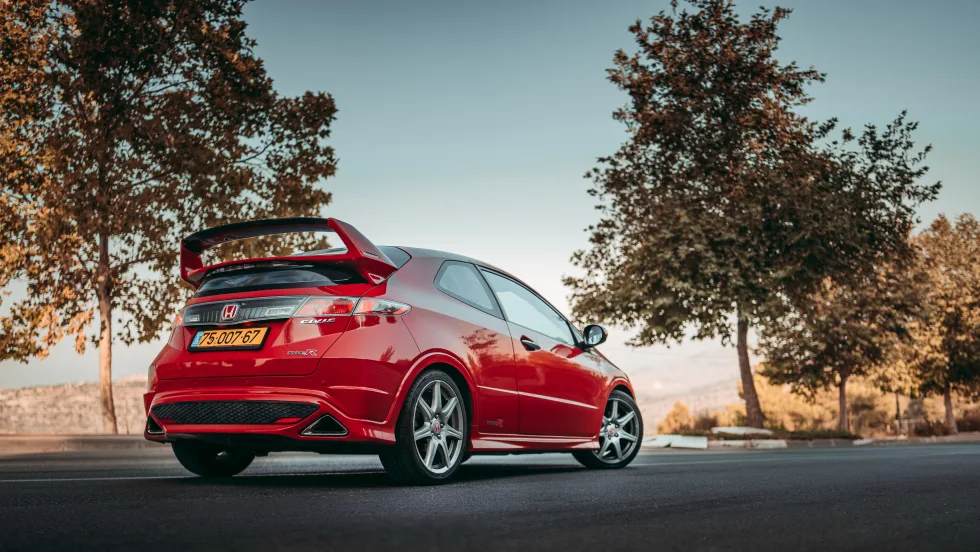
Next-Gen Hybrids in Sight
Dealerships can expect to see revamped hybrids from Honda next year as the company rolls out a new system and model lineup.
Read More →
Gem State Stores Change Hands
A larger auto group founded in the industry’s early years sold two franchises to a neighbor group that's on a growth spurt.
Read More →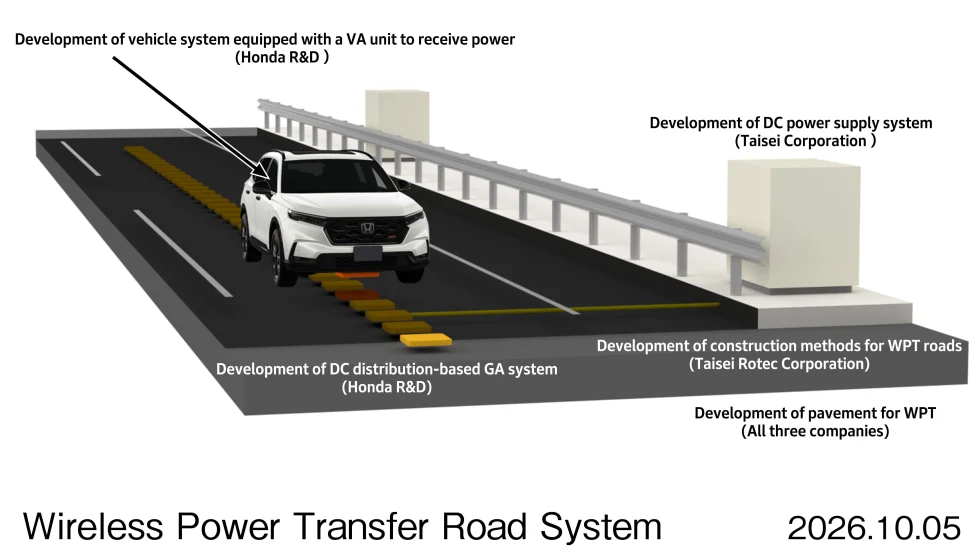
Charging In Motion
Honda has been researching wireless in-motion charging for electric vehicles since 2025, and new technology developments have put it a step closer to a final product.
Read More →
Twin Cities Stores Sell
Minnesota-based Walser Automotive Group made what it called the most significant acquisition in its history with a three-rooftop deal in Minneapolis.
Read More →
U.S. Auto Sales Still Below Prepandemic Levels
Mobility Global industry observers don’t expect the market to return to the higher volumes that became routine before Covid but to stay well below its potential.
Read More →
The Powertrain Shift
Electric-vehicle owners are backpedaling, according to new data, with product availability driving many to shift back to gas-powered engines.
Read More →
Achromatic Autos
The shades that dominate the U.S. car market don’t call attention to themselves, though grayscale may have plateaued after a 30-year upswing, research shows.
Read More →
Used-Vehicle Affordability Worsens
Listing prices in August defied seasonal trends, rising above $27,000 for the second time this year.
Read More →