National Safety Council Estimates Traffic Deaths Down Three Percent in 2013

Itasca, Ill. - The National Safety Council announced its preliminary estimate that approximately 35,200 motor vehicle fatalities occurred in 2013. This is a three percent decrease from 2012. Crash injuries requiring medical attention also are estimated to have fallen by two percent since 2012 to a total of 3.8 million.
Although 2013 traffic fatalities are three percent lower than 2012, they are one percent higher than 2011. The relatively high number of fatalities in 2012 appears to have been a one year bump, partially due to a mild winter. The 2013 numbers have dropped back down to 2010 and 2011 levels.
"More than 90% of crashes are due to human error," said John Ulczycki, vice president of Strategic Initiatives, National Safety Council. "Drivers are taking a lot of risks on our roads today – people are speeding, driving impaired from alcohol and drugs, not wearing seat belts, talking on phones, reading or sending e-mail and texts, and parents are letting teens drive before they are ready. We all need to look at the risks we take and the resulting harm that may be caused to ourselves and others. Many of these 35,200 fatalities last year surely involved people taking risks they thought they could handle. Sadly, they were wrong."
In addition to devastating human loss, car crashes present a significant national cost in lost wages and productivity, medical expenses, administrative expenses, employer costs and property damage. The estimated cost of motor vehicle deaths, injuries and property damage in 2013 was $267.5 billion, a three percent decrease from 2012.
Each month, motor vehicle fatality data is supplied to the National Safety Council by traffic authorities in 50 states and the District of Columbia. This data is used to make current year estimates based on the latest final count from the National Center for Health Statistics (NCHS). NSC counts total motor vehicle-related fatalities that occur within a year of the crash, consistent with data compiled from death certificates by the NCHS, and includes those occurring on public roadways and private property. This differs from the methods used by the National Highway Traffic Safety Administration. The NHTSA method counts traffic fatalities that occur within 30 days of a crash and only those occurring on public roadways.
More Industry
World EV Adoption Set to Grow
A new report says the segment, despite recent setbacks in some regions, is poised for acceleration as many countries look to reduce pollution.
Read More →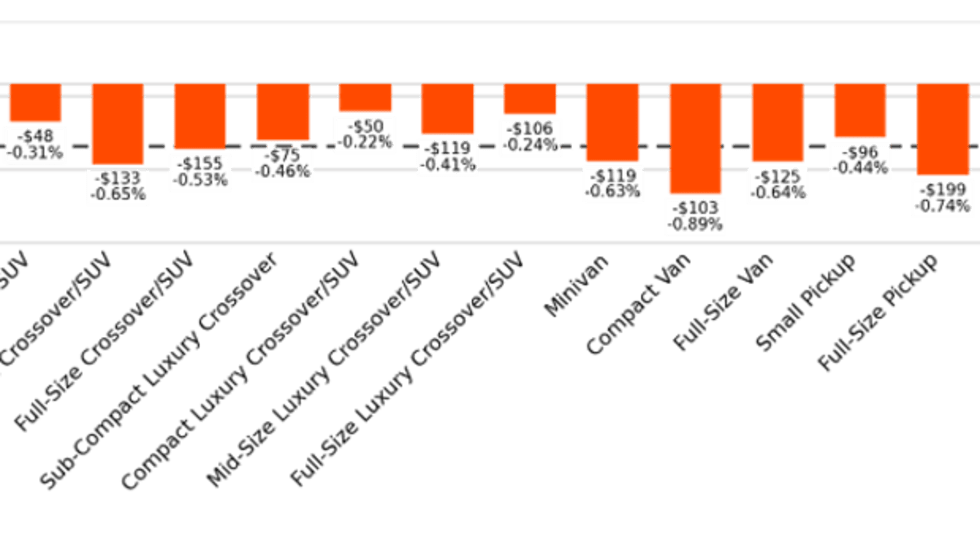
Black Book: Weekly Market Update
Wholesale automotive auction business stayed steady last week as bidders encountered lower prices, analysts observed.
Read More →
Pricing Transparency Drives Purchase Consideration
An annual study by JD Power found that clear pricing matters to consumers on automaker websites, so much so that it increases their purchase consideration.
Read More →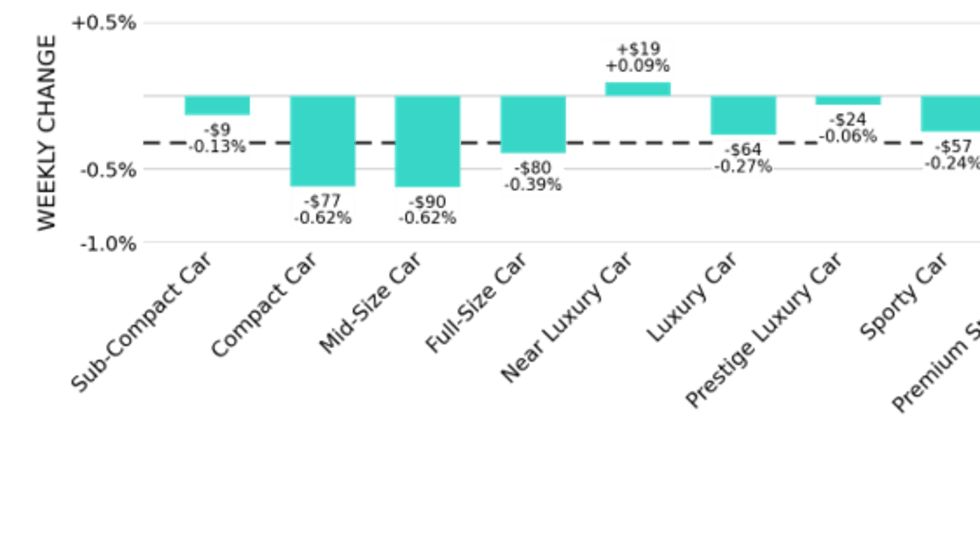
Black Book: Weekly Market Update
Used-vehicle market depreciation was the prevailing story in the wholesale market last week.
Read More →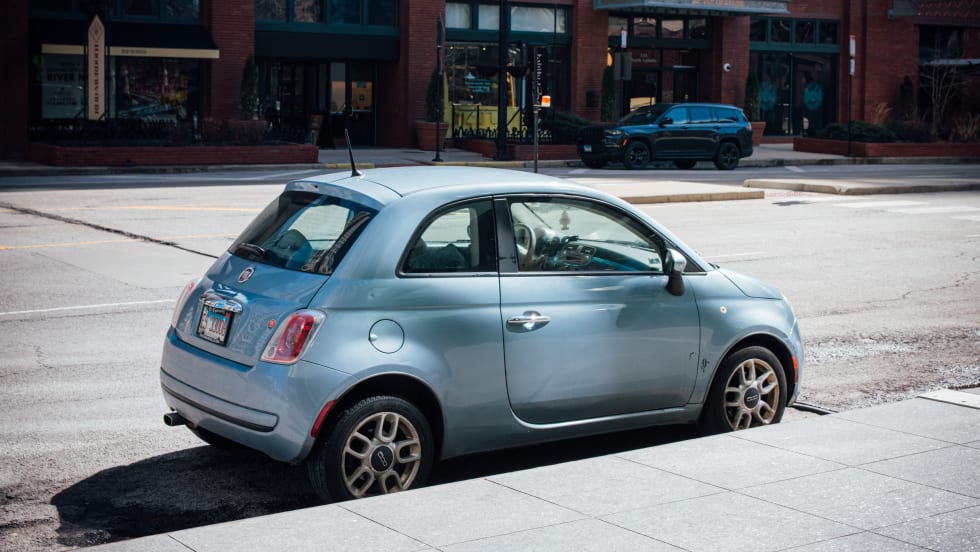
Smaller Is Looking Better
A growing number of Americans in the market for a new vehicle are opting for more affordable options, not waiting for market stability to bite the bullet.
Read More →
U.S. EV Market Slowly Stabilizes
U.S. electric-vehicle interest is slowly stabilizing since a major dip in sales after last year's end of the federal EV tax credit, and hybrids remain the leading electrified power train.
Read More →
Global EV Market Entering New Phase
Automakers are making investments to lower battery costs and optimize production to meet changing consumer needs.
Read More →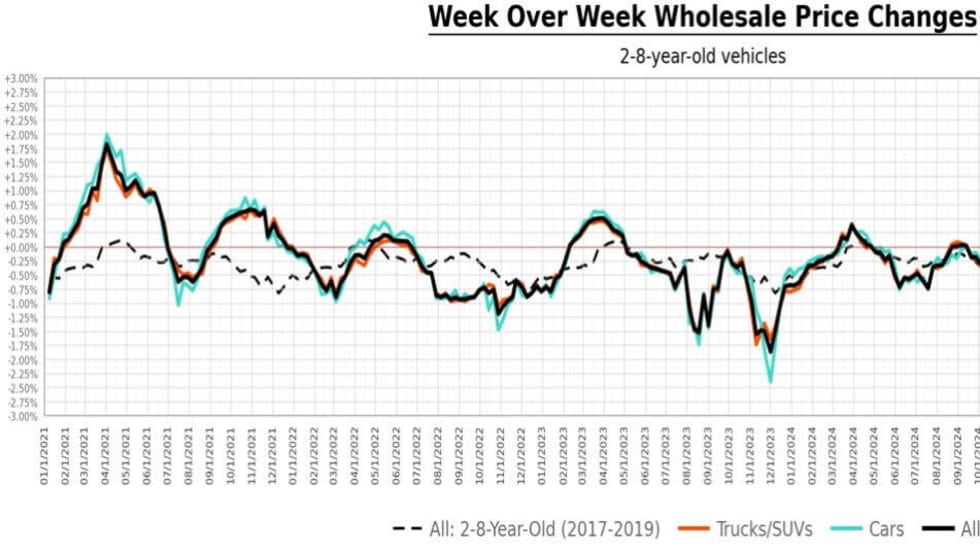
Black Book Weekly Market Update
The holiday weekend, not surprisingly, put a drag on wholesale automotive activity last week, analysts observed.
Read More →
Auto Affordability in Context
Cox Automotive points out the complex circumstances that have led to eye-popping vehicle prices.
Read More →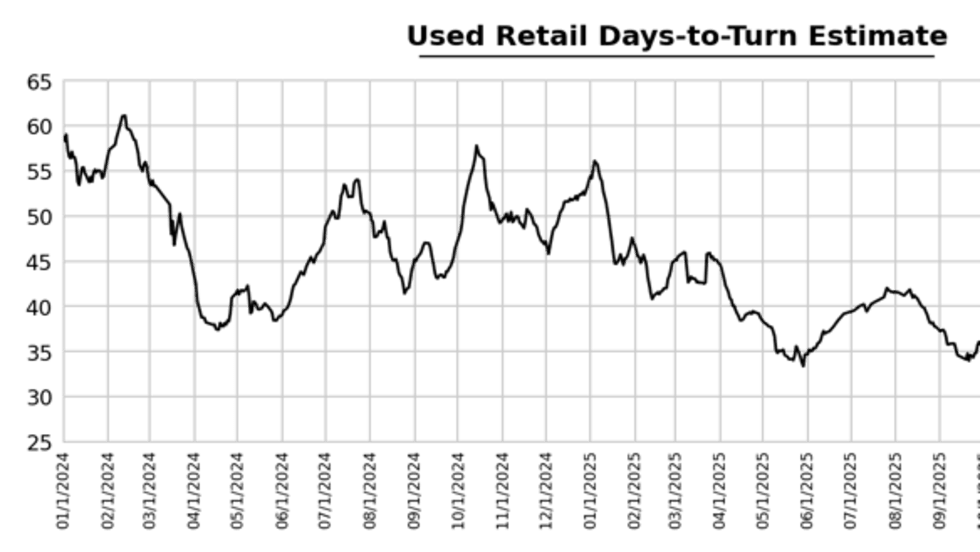
Black Book: Weekly Market Update
Automotive auction inventory increased last week, giving choosy bidders even more leeway.
Read More →