


Pump Price Jump Calculated
ISeeCars.com examined fuel costs for different power trains, finding which ones have experienced the biggest hits since the war in Iran commenced.

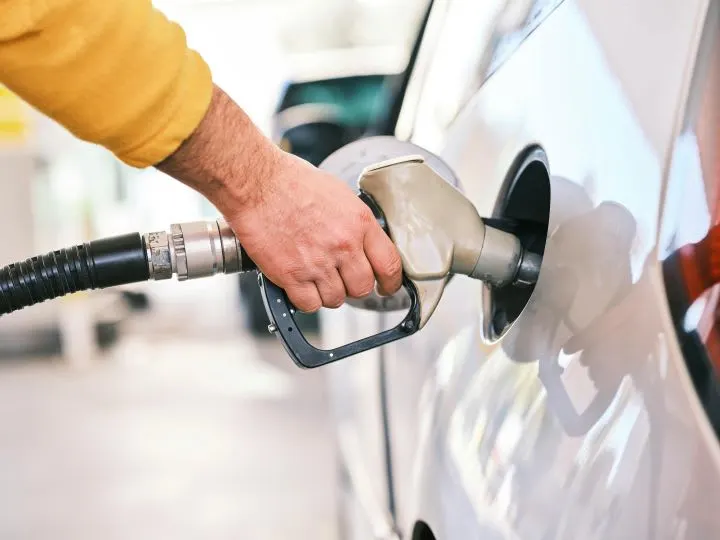
ISeeCars.com analyzed 2.1 million 3-year-old vehicles sold in 2025 to arrive at the fuel cost comparison.
Pexels/Engina Kyurt
Anybody who drives has at least noticed they’re paying more at the pump the past three months, whether it’s a painful dent in the wallet or not. Now the financial hit has been quantified.
For those with fully gas-powered models, the effect is significant, according to iSeeCars.com analysis of 2.1 million 3-year-old vehicles sold in 2025.
The automotive search engine and research provider calculated annual fuel costs for gas, hybrid and fully electric models based on average annual odometer readings and fuel costs in January and in April of this year.
Comparing the different drive trains put fuel costs in detailed perspective. Internal combustion engine models’ annual cost rose $706 in the studied time period compared to an $11 increase for purely electric models, iSeeCars found.
Hybrid models, meanwhile, though driven more miles annually on average than the other drive train types, cost about $700 less to fuel than gas vehicles, though their average fuel cost still rose by $486, according to the report. Plug-in hybrids’ cost increased by $279.
Gasoline price inflation resulted from the war the U.S. and Israel opened in Iran on Feb. 28. Iran has since limited shipping access to the Strait of Hormuz, through which about 21% of global petroleum normally flows, according to the U.S. Energy Information Administration, which calls the strait “the world’s most important oil transit chokepoint.”
The price of gas in the U.S. has consequently jumped 30%, and the inflation has disproportionately affected drivers of the large vehicles that have come to dominate American roads, iSeeCars pointed out. The higher-use, less fuel-efficient models, especially pickups, large SUVs and minivans, have brought the biggest financial hits.
Minivans, in fact, experienced the highest average fuel cost increase of all due to the fact that they tend to be driven significantly more miles per year – more than 19,000, iSeeCars reported.
“Trucks, minivans, and SUVs offer a wide range of functionality, which is why they are so popular with consumers,” company Executive Analyst Karl Brauer said. “Unfortunately, their highly functional, do-it-all nature combines with relatively low fuel efficiency to make them the most vulnerable to gas price spikes.”
Ironically, the Trump administration spearheaded the end of federal electric-vehicle incentives last year, including a consumer tax credit and public charger incentives. Then it joined with Israel to attack Iran, which quickly resulted in the Strait of Hormuz dilemma.
“You’d expect EV drivers to be largely shielded from the 30% rise in fuel prices over the past 3 months, and their $11 increase in annual fuel costs versus $706 for gasoline vehicles confirms it,” Brauer said.
Get iSeeCars’ full fuel analysis here.
More Industry
Charger Network Growth Slows
Despite a projected increase in public EV chargers in 2026, charging infrastructure remains a top concern for consumers as the gap between the most and least EV-friendly places remains substantial.
Read More →
Lenders, Consumers Take on More Auto Loan Risk
September records loosened credit access the most in over a decade as buyers took advantage of the conditions to afford trading, though loan applications fell.
Read More →
Next-Gen Hybrids in Sight
Dealerships can expect to see revamped hybrids from Honda next year as the company rolls out a new system and model lineup.
Read More →
Gem State Stores Change Hands
A larger auto group founded in the industry’s early years sold two franchises to a neighbor group that's on a growth spurt.
Read More →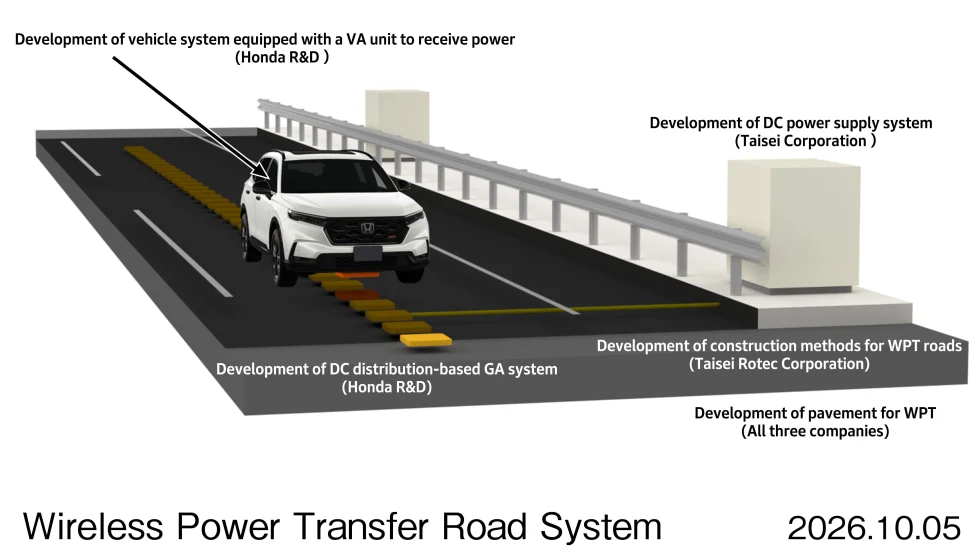
Charging In Motion
Honda has been researching wireless in-motion charging for electric vehicles since 2025, and new technology developments have put it a step closer to a final product.
Read More →
Twin Cities Stores Sell
Minnesota-based Walser Automotive Group made what it called the most significant acquisition in its history with a three-rooftop deal in Minneapolis.
Read More →
U.S. Auto Sales Still Below Prepandemic Levels
Mobility Global industry observers don’t expect the market to return to the higher volumes that became routine before Covid but to stay well below its potential.
Read More →
The Powertrain Shift
Electric-vehicle owners are backpedaling, according to new data, with product availability driving many to shift back to gas-powered engines.
Read More →
Achromatic Autos
The shades that dominate the U.S. car market don’t call attention to themselves, though grayscale may have plateaued after a 30-year upswing, research shows.
Read More →
Used-Vehicle Affordability Worsens
Listing prices in August defied seasonal trends, rising above $27,000 for the second time this year.
Read More →