


TransUnion: 60-day Rate Rises, Following Cyclical Pattern

CHICAGO — The national 60-day auto delinquency rate rose between the second and third quarters, but analysts for TransUnion.com said the rise was consistent with what has occurred in 2009. The report also showed that some states are emerging from the recession faster than others.
The 60-day delinquency rate rose from 0.73 percent in the second quarter to 0.81 percent in the third. The year-over-year delinquency rate also increased by 1.25 percent, according to TransUnion’s report, which analyzed approximately 27 million anonymous, randomly sampled, individual credit files, or 10 percent of credit-active U.S. consumers.
On a state-by-state basis, auto loan delinquency was highest in Mississippi and California at 1.53 percent and 1.33, respectively. The lowest auto loan delinquency rates were found in the District of Columbia (0.26 percent), North Dakota (0.35 percent) and South Dakota (0.37 percent).
The largest improvements in delinquency from the previous quarter were found in South Dakota (38.33 percent decrease from 0.60 percent) and the District of Columbia (38.10 percent decrease from 0.42 percent).
"The rise in the third quarter 60-day auto delinquency rate is more indicative of a cyclical pattern since the current automotive lending environment has remained consistent in its approach over the last 12 months," said Peter Turek, automotive vice president in TransUnion's financial services group. "On a state-level basis, seven states experienced a drop in their quarter-to-quarter delinquency rates while 22 showed a drop on a year-over-year basis. The drop in delinquency is an indicator that some states could emerge from the recession sooner than others."
Average auto debt nationwide continued to decrease slightly in the third quarter 2009, dropping from $12,560 to $12,542. Likewise, the year-over-year auto debt fell by 2.5 percent. The state with the largest auto debt burden was Nevada at $14,721 per auto borrower, followed by Texas at $14,425.
The lowest average auto debt was in Nebraska at $10,770. The steepest annual increases in average auto debt as a percentage occurred in Michigan (+3 percent), Alaska (+2.17 percent) and Vermont (+2.03 percent), while the District of Columbia experienced the sharpest drop in average auto debt (-3.78 percent) followed by Wyoming (-3.15 percent).
Looking forward, Turek said he expects the 60-day delinquency rate to reach almost 0.9 percent by year-end, which is a 7.5 percent increase over the prior year.
"Although the effects of the government's various stimulus programs seem popular and the auto industry has reported an increase in sales during the quarter, the weak labor market should continue to negatively impact the consumer into 2010,” said Turek. “As the new loans from the "clunkers" program show up on credit files, there is a good possibility average auto debt will increase. Since lenders had tightened their lending criteria prior to the "clunkers" program it also is expected the new loans will experience lower delinquencies.”
More Industry
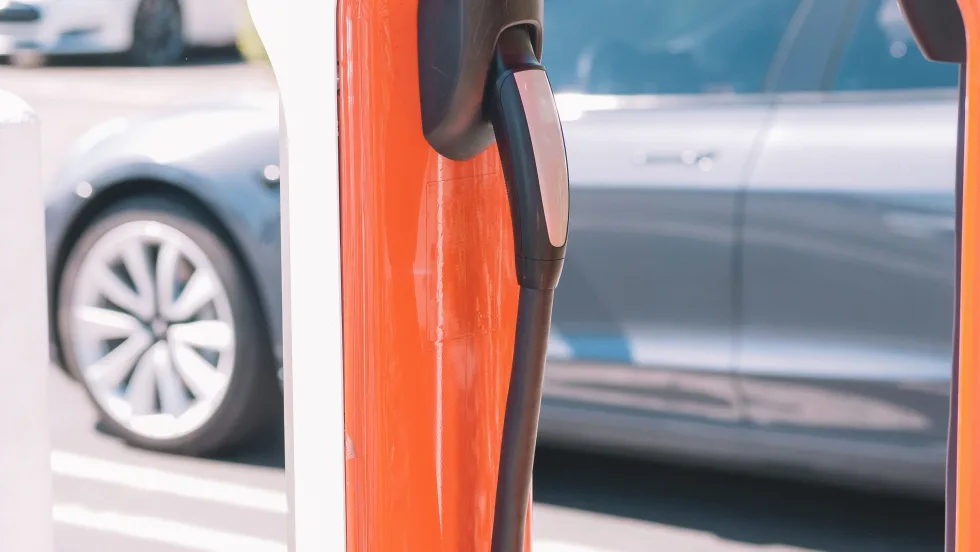
Charger Network Growth Slows
Despite a projected increase in public EV chargers in 2026, charging infrastructure remains a top concern for consumers as the gap between the most and least EV-friendly places remains substantial.
Read More →
Lenders, Consumers Take on More Auto Loan Risk
September records loosened credit access the most in over a decade as buyers took advantage of the conditions to afford trading, though loan applications fell.
Read More →
Next-Gen Hybrids in Sight
Dealerships can expect to see revamped hybrids from Honda next year as the company rolls out a new system and model lineup.
Read More →
Gem State Stores Change Hands
A larger auto group founded in the industry’s early years sold two franchises to a neighbor group that's on a growth spurt.
Read More →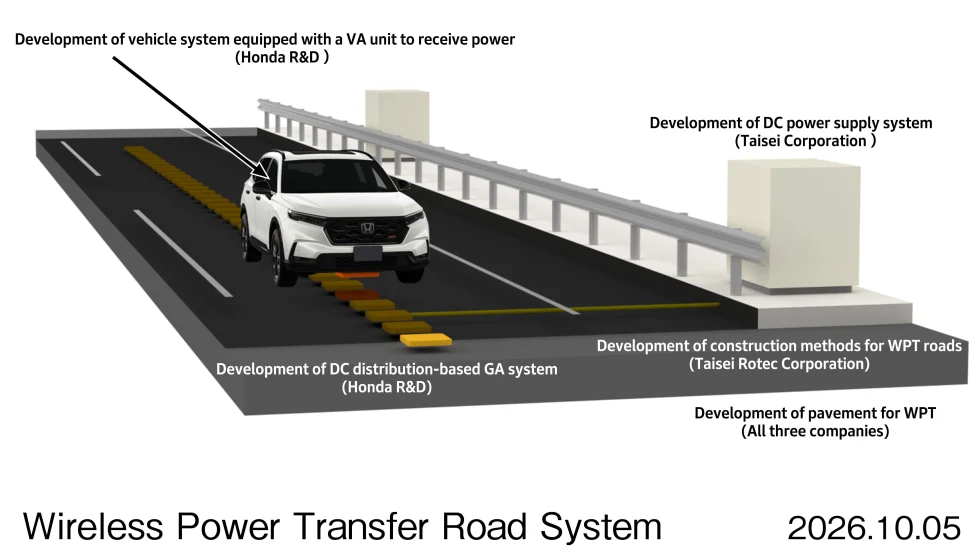
Charging In Motion
Honda has been researching wireless in-motion charging for electric vehicles since 2025, and new technology developments have put it a step closer to a final product.
Read More →
Twin Cities Stores Sell
Minnesota-based Walser Automotive Group made what it called the most significant acquisition in its history with a three-rooftop deal in Minneapolis.
Read More →
U.S. Auto Sales Still Below Prepandemic Levels
Mobility Global industry observers don’t expect the market to return to the higher volumes that became routine before Covid but to stay well below its potential.
Read More →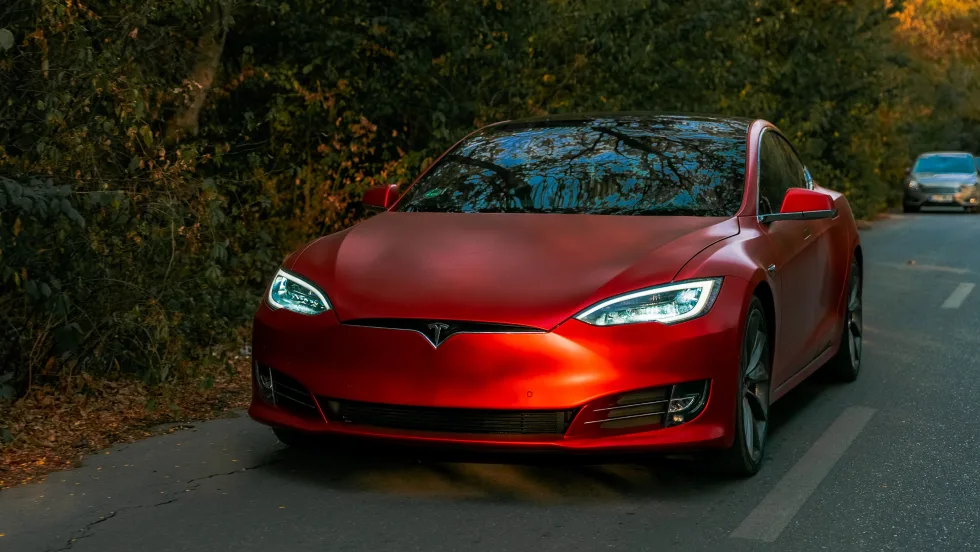
The Powertrain Shift
Electric-vehicle owners are backpedaling, according to new data, with product availability driving many to shift back to gas-powered engines.
Read More →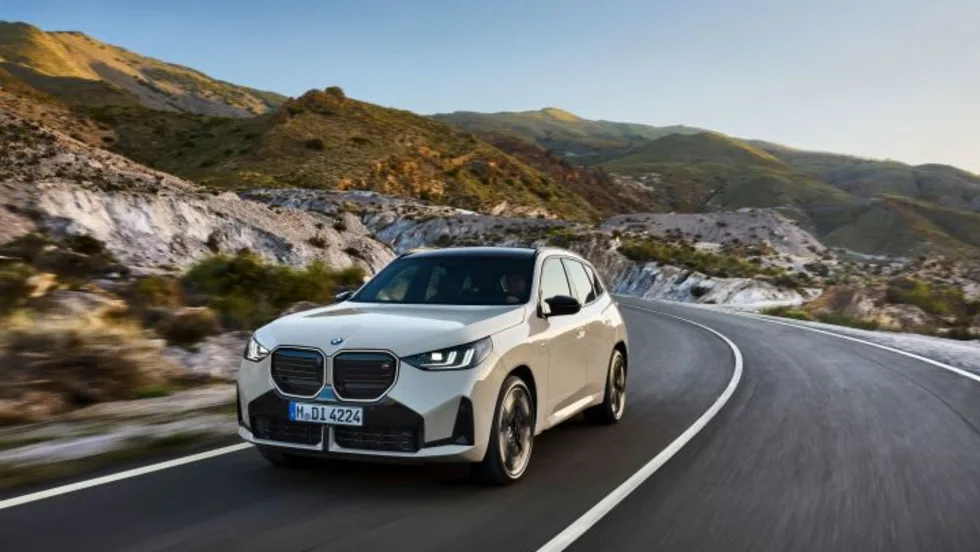
Achromatic Autos
The shades that dominate the U.S. car market don’t call attention to themselves, though grayscale may have plateaued after a 30-year upswing, research shows.
Read More →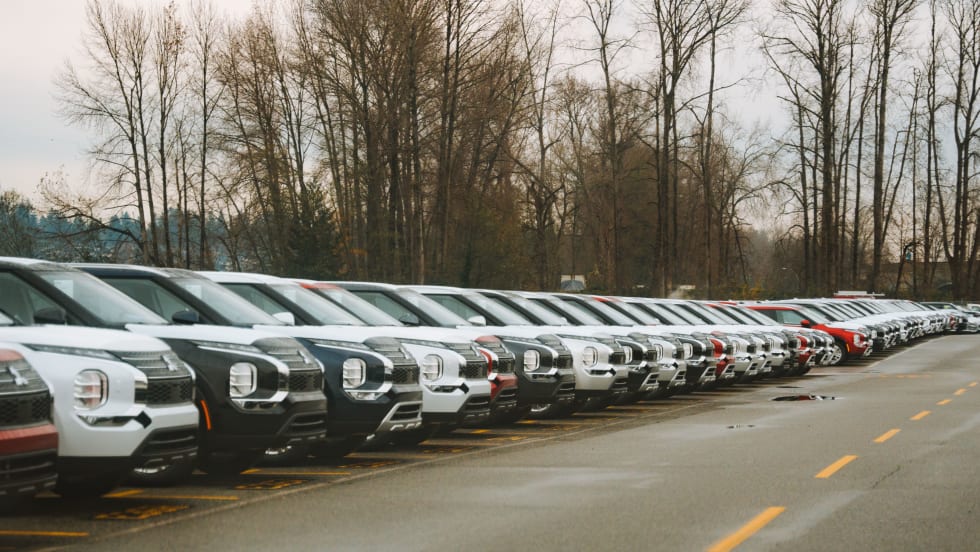
Used-Vehicle Affordability Worsens
Listing prices in August defied seasonal trends, rising above $27,000 for the second time this year.
Read More →