


Urban Classification, Business Volume's Affect on Fixed Ops Shown
Reynolds says new report proves improving operational efficiency, engaging technicians in selling maximize profitability, even for very busy service departments.


Reynolds' Jason Sideris points out there 'are differences between service departments in major urban versus rural settings and between high-volume and low-volume departments. By segmenting the data, we can all compare and understand outcomes more accurately.'
Reynolds and Reynolds
The Reynolds and Reynolds Co. released a new report focusing on several key fixed-operations metrics that drive decision-making at dealerships. It details both expected and unexpected data trends and provides insight into how dealerships can improve results. For the first time, Reynolds examines this data through the lens of urban classification and volume of business.
“When outcome sources become too diverse, benchmarks end up overly generic and applicable to very few actual cases,” said Jason Sideris, Reynolds vice president of Fixed Operations Product Management. “This report is a unique opportunity to provide dealers with a sharper image than the benchmark data the industry has previously supplied.
“We all know there are differences between service departments in major urban versus rural settings and between high-volume and low-volume departments. By segmenting the data, we can all compare and understand outcomes more accurately.”
Urban classification of the data is tied to the dealership’s ZIP code. To determine the classifications, Reynolds considered several factors, including:
The U.S. Census Bureau’s metropolitan statistical areas
A list of the most populated cities as estimated by the U.S. Census Bureau
ZIP code population
ZIP code population density per square mile
Each ZIP code, and by extension each dealership, is assigned one of four classifications: Major Urban, Metro, Community and Rural.
For volume, Reynolds referenced the number of customer pay repair orders a service department saw each month and assigned it a classification between 1 and 5.
Class 1: Fewer than 300
Class 2: 301 to 499
Class 3: 500 to 849
Class 4: 850 to 1,199
Class 5: 1,200 and up
The report also examines technicians’ impact on the metrics by their use of tools designed to increase efficiency and participation in the selling process. Ultimately, the report finds that impact is significant.
The release coincides with the start of the Reynolds Retail Summit: Amplify 2024. The event is designed to be a networking and educational experience for dealerships, regardless of dealer management system provider, to examine, explore and develop best practices and innovations that push the industry forward.
A full copy of the report can be found here.
Originally posted on Auto Dealer Today
More Industry

Charger Network Growth Slows
Despite a projected increase in public EV chargers in 2026, charging infrastructure remains a top concern for consumers as the gap between the most and least EV-friendly places remains substantial.
Read More →
Lenders, Consumers Take on More Auto Loan Risk
September records loosened credit access the most in over a decade as buyers took advantage of the conditions to afford trading, though loan applications fell.
Read More →
Next-Gen Hybrids in Sight
Dealerships can expect to see revamped hybrids from Honda next year as the company rolls out a new system and model lineup.
Read More →
Gem State Stores Change Hands
A larger auto group founded in the industry’s early years sold two franchises to a neighbor group that's on a growth spurt.
Read More →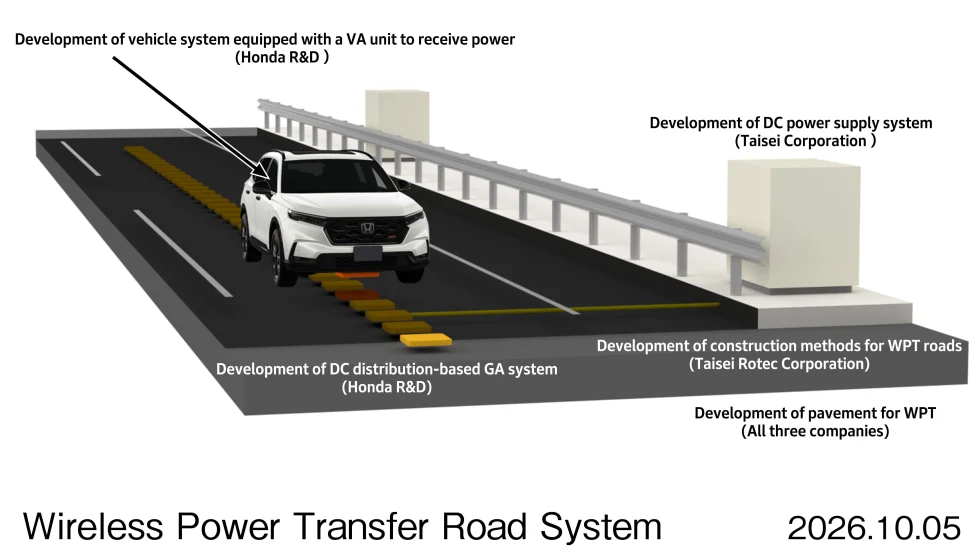
Charging In Motion
Honda has been researching wireless in-motion charging for electric vehicles since 2025, and new technology developments have put it a step closer to a final product.
Read More →
Twin Cities Stores Sell
Minnesota-based Walser Automotive Group made what it called the most significant acquisition in its history with a three-rooftop deal in Minneapolis.
Read More →
U.S. Auto Sales Still Below Prepandemic Levels
Mobility Global industry observers don’t expect the market to return to the higher volumes that became routine before Covid but to stay well below its potential.
Read More →
The Powertrain Shift
Electric-vehicle owners are backpedaling, according to new data, with product availability driving many to shift back to gas-powered engines.
Read More →
Achromatic Autos
The shades that dominate the U.S. car market don’t call attention to themselves, though grayscale may have plateaued after a 30-year upswing, research shows.
Read More →
Used-Vehicle Affordability Worsens
Listing prices in August defied seasonal trends, rising above $27,000 for the second time this year.
Read More →