Wholesale Prices, Week Ending June 24
With days to turn continuing to inch higher, auction sales rates are trending lower as dealers are being cautious about their purchases. We have yet to see retail listing prices follow the same path as wholesale, but typically retail lags wholesale by six to eight weeks, so the expectation is that the retail market will also begin to see prices declining soon.
This Week Last Week 2017-2019 Average (Same Week)
Car segments -0.44% -0.41% -0.12%
Truck & SUV segments -0.41% -0.37% -0.08%
Market -0.42% -0.38% -0.10%
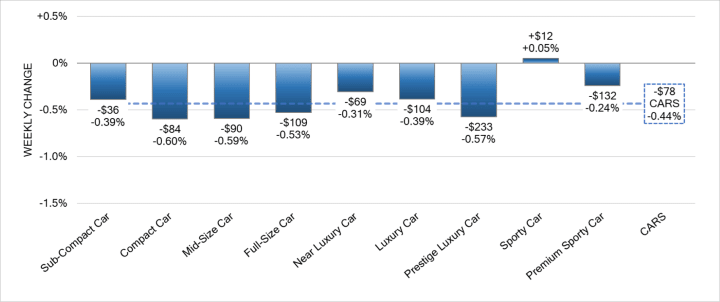
Car Segments
On a volume-weighted basis, the overall car segment decreased 0.44%. For reference, the previous week, cars decreased by 0.41%.
The other age units we track had similar trends, with the 0- to 2-year-old and 8- to 16-year-old cars declining 0.41%.
All but one of the nine car segments decreased last week.
Sporty car was the only segment to increase, but it was a minimal 0.05%. The segment has been up and down in recent weeks, but overall, it's reporting stability, with an average weekly change over the past month of 0.01%.
Truck / SUV Segments
The volume-weighted overall truck segment decreased 0.41%, staying consistent with the prior week’s decrease of 0.37%.
The 0- to 2-year-old truck segments reported a smaller decline last week (-0.29%), as did the 8- to 16-year-olds, which declined 0.24%.
All 13 truck segments reported a decrease.
The full-size luxury crossover/SUV segment had the largest decline, down 0.68%. That's the largest single week decline for the segment since mid-January.
Weekly Wholesale Index
The graphic below looks at trends in wholesale prices of 2- to 6-year-old vehicles indexed to the first week of the year. The index is computed keeping the average age of the mix constant to identify market movements.
Calendar years 2020 and 2021 ended with used wholesale prices at elevated levels. With economic patterns, including the automotive market, driven by the pandemic, normal seasonal patterns in the wholesale market, e.g., the 2019 calendar year, were not observed for most of the last three years. We saw a similar picture in 2009 at the end of the Great Recession. Calendar year 2021 did not have typical seasonality patterns, as the market had rapid increases in wholesale values for most of the year. The Wholesale Weekly Price Index reached the highest point of the year at the end of December 2021, reporting over 1.51 points. In 2022, the price index was on a mild rollercoaster until July, after which point prices were on a continuous decline until the end of the year.
Used Retail Prices
Used retail prices are more accessible than in years past due to the proliferation of no-haggle pricing for used-vehicle retailing. Transparent pricing upfront makes the car-buying process more enjoyable for customers and allows Black Book to accurately measure retail market trends.
At the onset of the pandemic, in CY2020, used retail prices increased slightly, following typical seasonal patterns, and then began dropping in April, finally hitting a low point in the late spring months. By late summer of CY2020, used retail prices increased as supply of new-vehicle inventory started to become scarce, but retail demand slowed at the end of the year, resulting in declining retail asking prices for the last several weeks. When CY2021 kicked off, demand rebounded while retail prices lagged slightly behind wholesale; March of 2021 started the dramatic increases in used retail prices, fueled by stimulus payments, tax season and shortages of new inventory. During the third quarter, retail prices continued to rise at a slower rate but soon picked up once again to start the fourth quarter, when prices steadily increased week after week. As CY2021 came to an end, the retail listing price index closed 36% above where the year began. It remained relatively stagnant through most of CY2022. In the fourth quarter, the Retail Listings Price Index declines started but were not as steep as the wholesale price index.
This analysis is based on approximately two million vehicles listed for sale on U.S. dealer lots. The grapich below looks at 2- to 6-year-old vehicles. The index is computed keeping the average age of the mix constant to identify market movements.
Inventory
Used Retail
The Used Retail Active Listing Volume Index reverted back to one at the start of 2023. Currently, the index sits at 1.01 points, up from the slight dips we saw at the beginning of the year and above the 1.00 mark for the first time this year.
The used retail days-to-turn estimate is currently around 50.
Wholesale
Lower conversion rates and more no-sales in the past few weeks seem to be the theme for June. All the truck segments have declined in the last two weeks while most car segments also saw a decline, with the exception of sporty car. The larger wholesale sellers continue to do well, but the smaller sellers are struggling to move vehicles at the auction.
As always, the Black Book team of analysts will keep their eyes on the market watching for developing trends and insights.
The Estimated Average Weekly Sales Rate decreased to 46% last week.