Q1 Bankruptcy Filings Increase Nearly 18% Over 2009

ALEXANDRIA, Va.— The total number of U.S. bankruptcy cases filed during the first three months of 2010 increased 17.5 percent over the same period in 2009, according to data released by the Administrative Office of the U.S. Courts.
As total filings reached 388,148 during the first calendar year quarter of 2010 (Jan. 1 – March 31), the total surpassed the 330,394 new cases that were filed over the same period in 2009. The total filings in the 2010 first quarter also represent a 4.3 percent increase from the 372,203 bankruptcies filed during the fourth quarter of 2009 (Oct. 1 – Dec. 31).
“As Congress continues to consider financial regulatory reforms to address the causes of the economic downturn, consumers and business are still turning to bankruptcy to find relief from financial distress,” said Samuel J. Gerdano, ABI Executive Director. “We expect filings to surge past 1.5 million cases by year-end.”
Consumer filings increased 18.2 percent to 373,541 for the three-month period ending March 31, 2010, from the 2009 first quarter total of 316,158. They also represent a 4.6 percent increase from the fourth quarter of 2009, which recorded a total of 357,183 nonbusiness filings. The percentage of consumers filing for chapter 13 protection fell slightly from 29.2 percent during the first quarter of 2009 (January 1-March 31) to 27.1 percent over the same period in 2010. The number of consumers filing for chapter 7 protection increased to 72.8 percent during the first three months of 2010, the largest percentage of consumer chapter 7 filers since the implementation of BAPCPA in 2005.
Business filings for the three-month period ending March 31, 2010 totaled 14,607, representing a 2 percent increase over the first quarter 2009 total of 14,319. The first quarter 2010 business filing total represented a 2.8 percent decrease, however, from the fourth quarter 2009 total of 15,020.
The 12-month filing total of 1,531,997 for the period ending March 31, 2010, is an increase of 27.4 percent from the same period in 2009, which totaled 1,202,395 filings. Nonbusiness filings for the 12-month period ending March 31, 2010, totaled 1,470,849, up 27.5 percent from the 1,153,318 total nonbusiness filings in the 12-month period ending March 31, 2009. Business filings for the 12-month period ending March 31, 2010, totaled 61,148, up 24.6 percent from the 49,077 business filings in the 12-month period ending March 31, 2009.
The 1,100,032 total chapter 7 filings for the 12-month period ending March 31, 2010, represent a 34.2 percent increase from the 819,304 filings from the same period in 2009. Total chapter 13 filings increased 12.2 percent to 415,966 in the 12-month period ending March 31, 2010 from 370,836 in the same period last year. During this same 12-month period, total chapter 11 filings also increased, rising 29.5 percent to 15,251 in 2010 from 11,774 in 2009, and chapter 12 filings increased 64.8 percent to 605 in 2010 compared to 367 filings in 2009.
The chapter breakdown of BUSINESS filings for the 3-month period ending March 31, 2010, is: 10,074 chapter 7s, 3,293 chapter 11s, 163 chapter 12s and 1,043 chapter 13s.
The chapter breakdown of NON-BUSINESS filings for the 3-month period ending March 31, 2010, is: 272,048 chapter 7s, 440 chapter 11s and 101,051 chapter 13s.
States with the HIGHEST PER CAPITA FILING RATE (Total Filings) for the 12-month period ending March 31, 2010:
Nevada
Tennessee
Georgia
Indiana
Alabama
Michigan
Ohio
California
Illinois
Kentucky
Districts with the HIGHEST PERCENTAGE INCREASE in total filings for the 12-month period ending March 31, 2010 (compared to the identical period in 2009):
District of Arizona: 69.2%
District of the Virgin Islands: 58.8%
Central District of California: 57.8%
District of Wyoming: 53.3%
Northern District of California: 50.5%
More Industry

World EV Adoption Set to Grow
A new report says the segment, despite recent setbacks in some regions, is poised for acceleration as many countries look to reduce pollution.
Read More →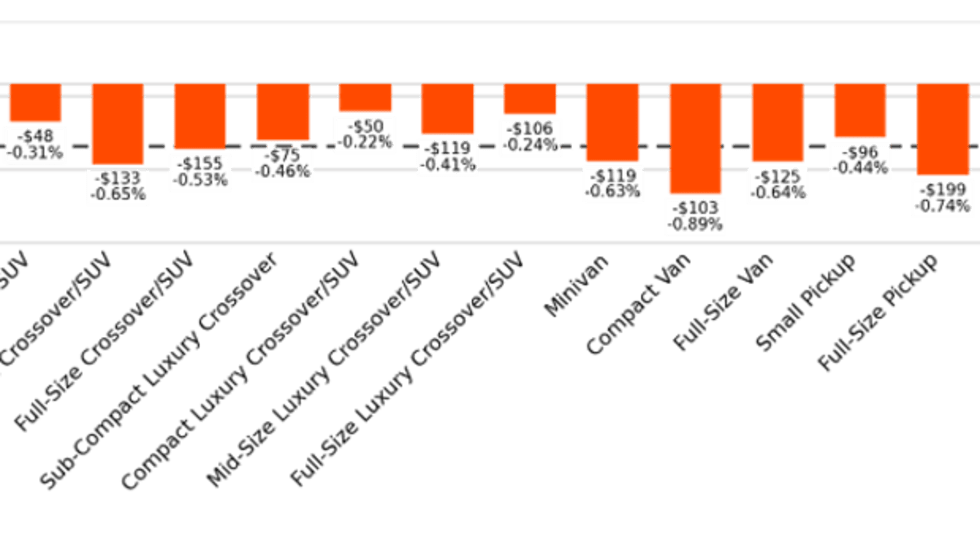
Black Book: Weekly Market Update
Wholesale automotive auction business stayed steady last week as bidders encountered lower prices, analysts observed.
Read More →
Pricing Transparency Drives Purchase Consideration
An annual study by JD Power found that clear pricing matters to consumers on automaker websites, so much so that it increases their purchase consideration.
Read More →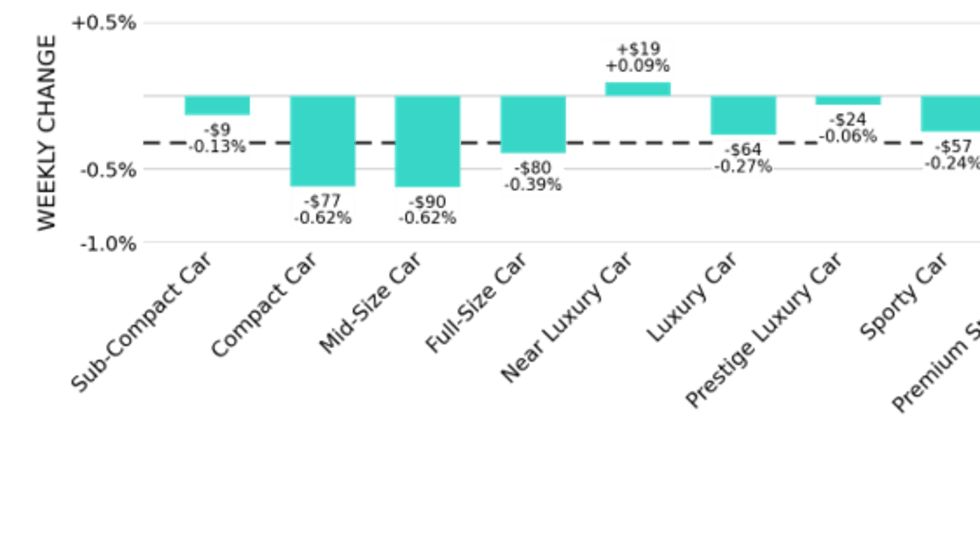
Black Book: Weekly Market Update
Used-vehicle market depreciation was the prevailing story in the wholesale market last week.
Read More →
Smaller Is Looking Better
A growing number of Americans in the market for a new vehicle are opting for more affordable options, not waiting for market stability to bite the bullet.
Read More →
U.S. EV Market Slowly Stabilizes
U.S. electric-vehicle interest is slowly stabilizing since a major dip in sales after last year's end of the federal EV tax credit, and hybrids remain the leading electrified power train.
Read More →
Global EV Market Entering New Phase
Automakers are making investments to lower battery costs and optimize production to meet changing consumer needs.
Read More →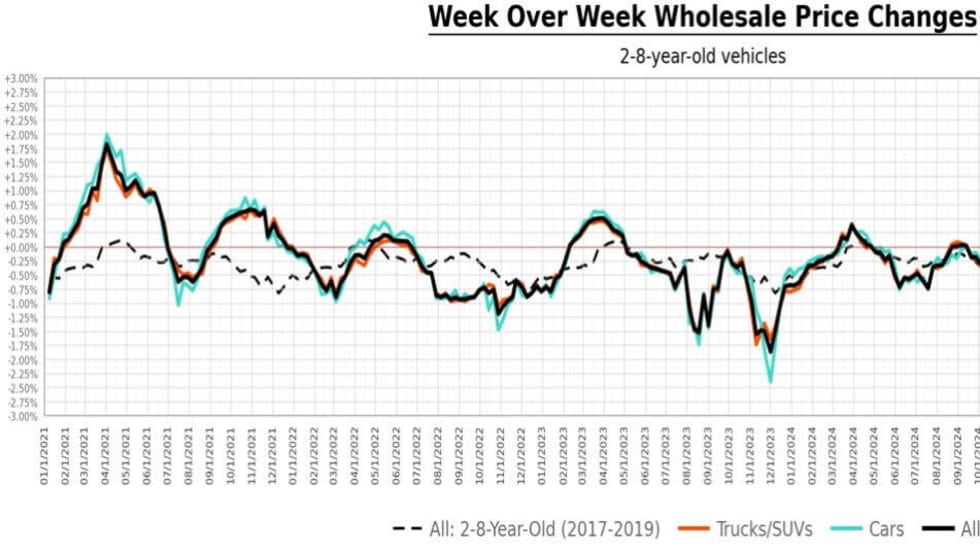
Black Book Weekly Market Update
The holiday weekend, not surprisingly, put a drag on wholesale automotive activity last week, analysts observed.
Read More →
Auto Affordability in Context
Cox Automotive points out the complex circumstances that have led to eye-popping vehicle prices.
Read More →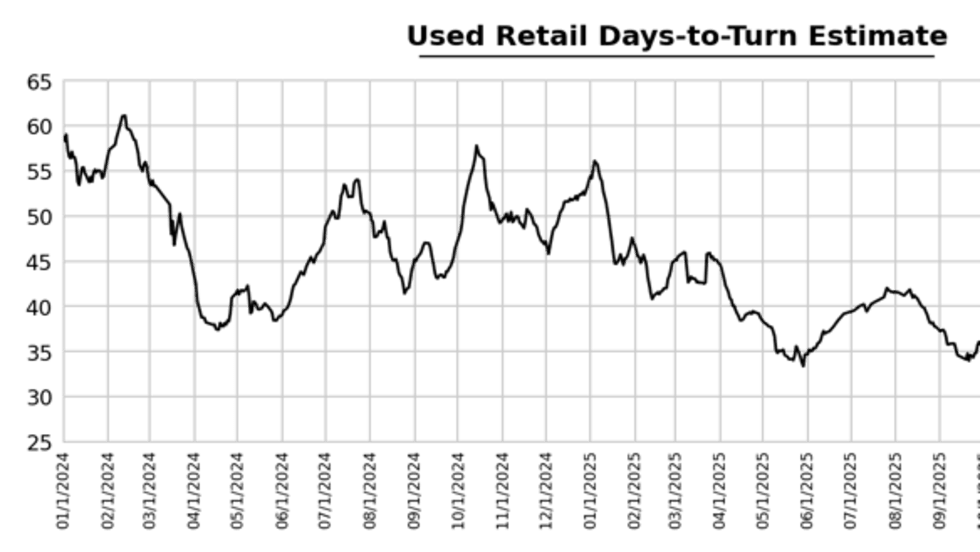
Black Book: Weekly Market Update
Automotive auction inventory increased last week, giving choosy bidders even more leeway.
Read More →