


The Missing Metric to Increasing Underwriting Profit - UPI


The Missing Metric to Increasing Underwriting Profit - UPI
It happens to all of us. You are running late. You get in your car. You turn the key and it will not start. This is the nightmare that vehicle service contract holders face every day. And what is their top concern? Getting back on the road as soon as possible. The contract holder does not care about the call center ASA, or the average cost of a claim. All they care about is getting back on the road without much hassle or personal cost.
Then, there is the service advisor who receives several vehicles every day with sometimes extensive repairs. Their priority is moving the vehicles through the repair process as quickly as possible, while increasing their dealership or service center’s profit margin. When a service advisor realizes a service contract is in play, they can often think, "Great, I have another hoop to jump through to get this moving, I have other clients waiting, and now I have to call a warranty company and be on hold forever!" So they reach out to the contact center hoping that there is a low ASA. They need to get this called in quickly, and they hope there is rental coverage so that the impatient customer can get on with their day. And the cost of the claim? Well the more they can sell to the warranty company, the less they have to sell to the customer!
Besides the obvious customer and service center, there is one more viewpoint to take into consideration, and it's an important one. What does the stakeholder want or need? In this case, the stakeholder is neither the customer nor the service center. Instead, it is the obligor, the administrator, and/or the underwriter. While they pay close attention to statistics regarding contact center performance and customer service, they also evaluate the financial performance of the underwriting portfolio. They are constantly asking themselves, “How well is it working? What are the loss ratios? What is the investment income?”
The administrator managing the contact center, cares about all of the above. Administrators want contract holders safely on the road, want a low ASA for the repair facility and for agent satisfaction, and they definitely want to watch the claim cost. Product administrators monitor these daily and use them as benchmarks against the competition. But, as an industry are we missing something?
As administrators, how claims are adjudicated affects the financial performance of each product. In fact, it's the only way to directly impact underwriting performance. If an administrator overpays on claims, they can potentially use too much reserve. However, if they have a high denial rate, they can potentially cultivate angry customers and high legal fees, which is worse than overpaying claims. Managing this delicate balance has been a constant struggle for administrators. However, a new index has evolved to help achieve a greater balance.
The underwriting performance index (UPI) is a measurement of improvement in underwriting fund performance based on the reduction of repeat repairs during the lifecycle of a vehicle service contract. The intended result of implementing the UPI is to increase underwriting reserves at the end of the contract lifecycle. This measurement is entirely dependent on the claims process and does not take into account investment income.
The key to UPI is the reduction of repeat repairs during the contract life cycle, meaning you only pay to repair a certain component one time. With that in mind, administrators don’t need to change their entire contract portfolio with a “1-time” limitation, but rather transfer the risk of a repaired part to an independent third party, such as a part provider or repair facility.
The third party would then assume all responsibilities if the part fails again during the contract life cycle. This repair coverage would be classified as “End of Contract” or EOC. A simple example is if a water pump is replaced in the first year of the vehicle service contract, and the pump fails again during the lifecycle of the contract, then the third party pays for the repair: parts, labor, and deductible.
But how often does the risk of a repeat repair come into play and does it really matter? The risk is dependent on the repair preferences of the contract holder. Contract holders that service exclusively at an OEM manufacturer service department run a less than 1% risk of repeat repair based on the failure rate of the parts. But, those who service at a local independent service center have a much higher risk due to the selection of the parts used.
There is a vast quality range of aftermarket parts, with failure rates increasing from 3.5 percent to over 10 percent. Service contracts are not rated to sustain the risk of a high part failure rate because the consumer is more likely to choose a different repair facility on the second failure due to perceived quality of repair. Typically, because the repair warranty is backed by a local shop, the service contract gets caught in the middle of the debate on who should pay for the repair and ends up paying for the same repair at a different facility with no recourse to recover the expense.
There are several EOC coverage options available for repairs. Some national repair franchises offer extended warranty terms for a fee. Depending on several factors such as the total cost of the repair, the additional fee, and failure rate of the repair this may be an option. However, the most common option for this coverage is the third party parts supplier. Common practice is to extend coverage on the part and the labor for installation on both OEM and aftermarket parts.
It is possible to source both OEM and aftermarket parts with the EOC coverage for less than the list price with a standard 12 month/12,000 mile warranty offered by the repair facility. An important factor that must be considered is the cost of the EOC coverage. If the part with EOC coverage exceeds the list price of the original replacement part, then the gain in the underwriting reserve is eliminated. Through consolidation and negotiation with parts suppliers, it is possible to source over 90% of parts with EOC coverage at or below list pricing. With advanced technologies, parts sourcing can be a seamless part of the claims process.
An additional consideration is the age and mileage of the vehicles within the contract portfolio. Owners of older high-mileage vehicles tend to service at non-OEM repair facilities. Claim frequency is also increased due to the age and mileage, so the ability to limit the exposure for repeat claims is critical to maintaining acceptable loss ratios. Below is an example of the UPI applied to a line of business performing at an 80% loss ratio. Parts failure data from C&K Auto Parts, including OEM, remanufactured, and aftermarket parts, yields a blended 3.5% across all manufacturers. In this scenario, the application of EOC coverage yields an independent gain of 2.8% of the claims reserve.
As the third party administration industry grows more competitive, focusing on a metric to distinguish performance is key to future growth and stakeholder satisfaction. So far, UPI has proven to be the only measurement that can yield a return almost equal to investment income, while fulfilling the term of contracts by paying every eligible claim.
More Industry
Charger Network Growth Slows
Despite a projected increase in public EV chargers in 2026, charging infrastructure remains a top concern for consumers as the gap between the most and least EV-friendly places remains substantial.
Read More →
Lenders, Consumers Take on More Auto Loan Risk
September records loosened credit access the most in over a decade as buyers took advantage of the conditions to afford trading, though loan applications fell.
Read More →
Next-Gen Hybrids in Sight
Dealerships can expect to see revamped hybrids from Honda next year as the company rolls out a new system and model lineup.
Read More →
Gem State Stores Change Hands
A larger auto group founded in the industry’s early years sold two franchises to a neighbor group that's on a growth spurt.
Read More →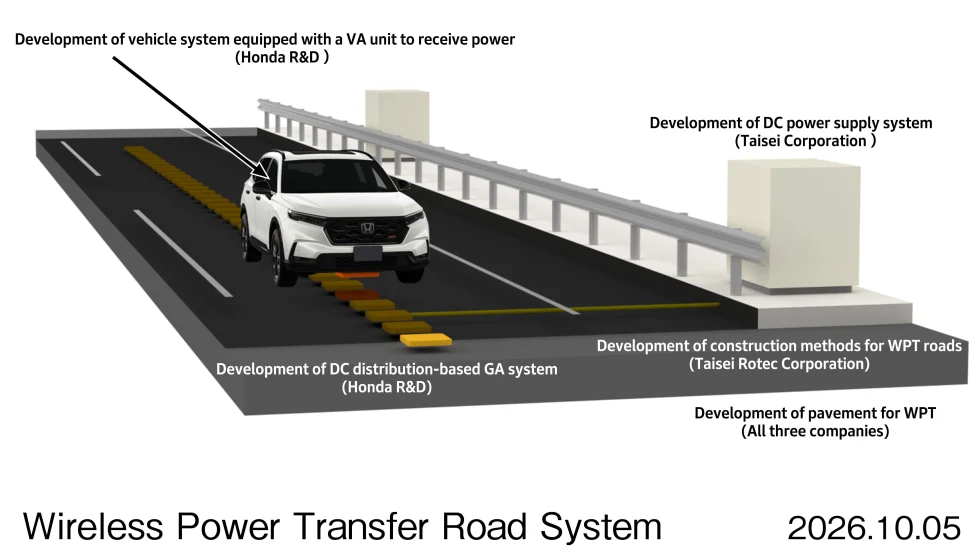
Charging In Motion
Honda has been researching wireless in-motion charging for electric vehicles since 2025, and new technology developments have put it a step closer to a final product.
Read More →
Twin Cities Stores Sell
Minnesota-based Walser Automotive Group made what it called the most significant acquisition in its history with a three-rooftop deal in Minneapolis.
Read More →
U.S. Auto Sales Still Below Prepandemic Levels
Mobility Global industry observers don’t expect the market to return to the higher volumes that became routine before Covid but to stay well below its potential.
Read More →
The Powertrain Shift
Electric-vehicle owners are backpedaling, according to new data, with product availability driving many to shift back to gas-powered engines.
Read More →
Achromatic Autos
The shades that dominate the U.S. car market don’t call attention to themselves, though grayscale may have plateaued after a 30-year upswing, research shows.
Read More →
Used-Vehicle Affordability Worsens
Listing prices in August defied seasonal trends, rising above $27,000 for the second time this year.
Read More →