


Black Book: Weekly Market Update
The compact car segment had the largest decline among cars, though it was still less than the prior week’s decline of 0.94%.

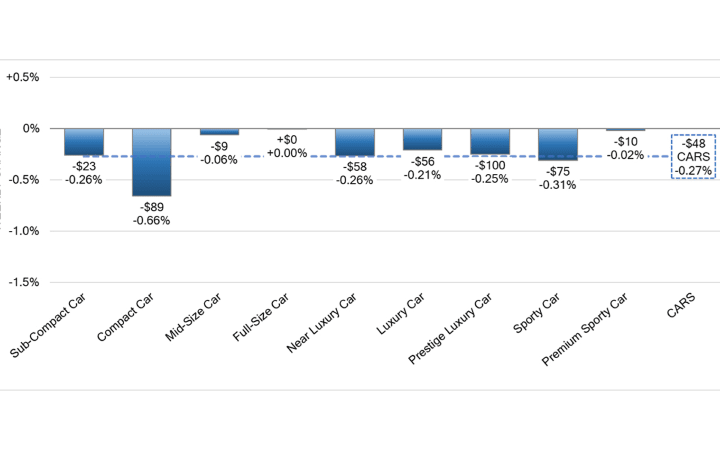
Wholesale Prices, Week Ending July 29
After a few weeks of heavy declines across the board, the market appears to be leveling off. This is particularly true for some of the car segments; full-dize cars declined a very minimal 0.001%. In sharp contrast, full-size trucks (-0.64%) reported their largest single-week decline since December.
This Week Last Week 2017-2019 Average (Same Week)
Car segments -0.27% -0.59% -0.31%
Truck & SUV segments -0.41% -0.50% -0.19%
Market -0.37% -0.53% -0.24%
Car Segments
On a volume-weighted basis, the overall car segment decreased 0.27%. In the previous week, cars decreased by 0.59%.
The 0- to 2-year-old car segments were down 0.23%, and 8- to 16-year-old cars declined 0.40%.
All nine car segments decreased.
Full-size (-0.001%), sporty (-0.02%) and midsize (-0.06%) car segments all reported stability. In sharp contrast, the compact car segment had the largest decline at 0.66%, though it was still less than the prior week’s decline of 0.94%.
The luxury segments reported smaller declines than seen in recent weeks. For example, premium sporty was down 0.02%, compared with -0.24% the week prior, and near luxury car was down 0.26%, compared with -0.58% the previous week.
Truck / SUV Segments
The volume-weighted overall truck segment decreased 0.41%, less than the prior week’s decrease of 0.50%.
The 0- to 2-year-old truck segments reported a smaller decline last week (-0.36%), but the 8- to 16-year-olds depreciated by 0.46%.
All 13 truck segments reported a decrease.
Compact luxury xrossovers reported the largest decrease last week, down 0.85%. That marks the ninth consecutive week of declines for the segment, with an average weekly change of -0.74%.
Full-size pickups have been declining for eight consecutive weeks, but last week, the segment had the largest single-week decline (-0.64%) since December. Over the past eight weeks, the segment has averaged a weekly decline of 0.36%.
Weekly Wholesale Index
The graphic below looks at trends in wholesale prices of 2- to 6-year-old vehicles indexed to the first week of the year. The index is computed keeping the average age of the mix constant to identify market movements.
Used Retail Prices
Used-retail prices are more accessible than in years past due to the proliferation of no-haggle pricing. Transparent pricing upfront makes the car-buying process more enjoyable for customers and allows Black Book to accurately measure retail market trends. At the onset of the pandemic, in CY2020, used-retail prices increased slightly, following typical seasonal patterns, and then began dropping in April, finally hitting a low in the late spring months. By late summer of CY2020, they increased as the supply of new-vehicle inventory started to become scarce, but retail demand slowed at the end of CY2020, resulting in declining retail asking prices for the last several weeks of the year. When CY2021 kicked off, demand rebounded while retail prices lagged slightly behind wholesale; March 2021 started the dramatic increases in used-retail prices, fueled by stimulus payments, tax season and shortages of new inventory. During the third quarter, retail prices continued to rise at a slower rate but soon picked up again to start the fourth quarter, when retail listings steadily increased. As CY2021 came to an end, the retail listing price index closed 36% above where the year began. The index remained relatively stagnant through most of CY2022. In the fourth quarter of 2022, the Retail Listings Price Index started to decline but not as steeply as the wholesale price index.
This analysis is based on approximately two million vehicles listed for sale on U.S. dealer lots. The graphic below looks at 2- to 6-year-old vehicles. It's computed keeping the average age of the mix constant to identify market movements.
Inventory
Used Retail
The Used Retail Active Listing Volume Index currently sits at 1.02 points.
The Used Retail days-to-turn estimate is currently around 51.
Wholesale
In the auction lanes, demand picked up for some of the car segments that have lower supply. With many manufacturers pulling away from production of sedans, the demand at auction is higher than in some of the SUV segments that are seeing larger depreciation rates.
Last week, conversion rates continued to show improvement, despite dealers’ days to turn remaining in the 50-plus range. Additionally, the condition of units is a challenge for buyers who are looking for retail-ready units.
As always, the Black Book team of analysts will keep their eyes on the market, watching for developing trends and insights.
The estimated Average Weekly Sales Rate continued to improve, increasing to 49% last week.
Originally posted on Auto Dealer Today
More Industry
Charger Network Growth Slows
Despite a projected increase in public EV chargers in 2026, charging infrastructure remains a top concern for consumers as the gap between the most and least EV-friendly places remains substantial.
Read More →
Lenders, Consumers Take on More Auto Loan Risk
September records loosened credit access the most in over a decade as buyers took advantage of the conditions to afford trading, though loan applications fell.
Read More →
Next-Gen Hybrids in Sight
Dealerships can expect to see revamped hybrids from Honda next year as the company rolls out a new system and model lineup.
Read More →
Gem State Stores Change Hands
A larger auto group founded in the industry’s early years sold two franchises to a neighbor group that's on a growth spurt.
Read More →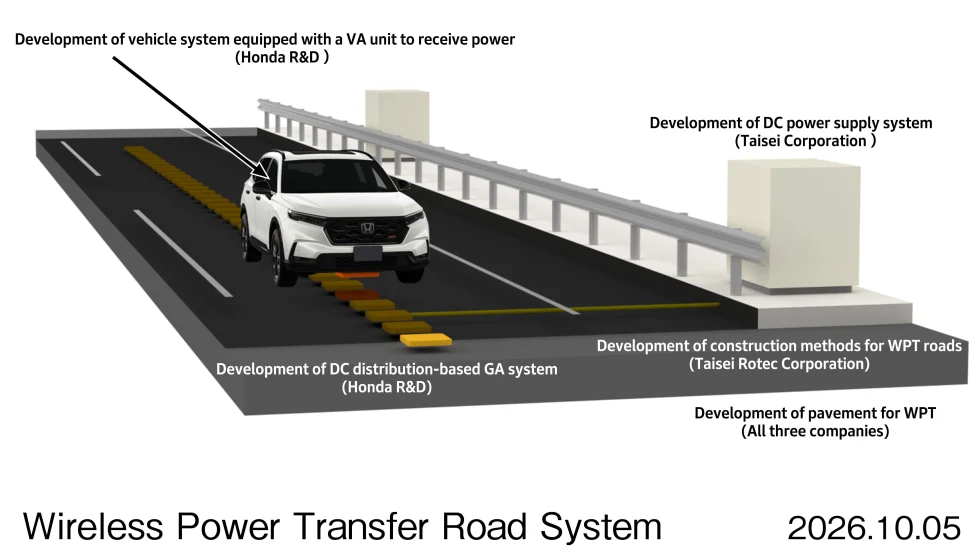
Charging In Motion
Honda has been researching wireless in-motion charging for electric vehicles since 2025, and new technology developments have put it a step closer to a final product.
Read More →
Twin Cities Stores Sell
Minnesota-based Walser Automotive Group made what it called the most significant acquisition in its history with a three-rooftop deal in Minneapolis.
Read More →
U.S. Auto Sales Still Below Prepandemic Levels
Mobility Global industry observers don’t expect the market to return to the higher volumes that became routine before Covid but to stay well below its potential.
Read More →
The Powertrain Shift
Electric-vehicle owners are backpedaling, according to new data, with product availability driving many to shift back to gas-powered engines.
Read More →
Achromatic Autos
The shades that dominate the U.S. car market don’t call attention to themselves, though grayscale may have plateaued after a 30-year upswing, research shows.
Read More →
Used-Vehicle Affordability Worsens
Listing prices in August defied seasonal trends, rising above $27,000 for the second time this year.
Read More →