
Black Book Market Insights
Wholesale Prices, Week Ending July 23rd

The Estimated Average Weekly Sales Rate remains somewhat stagnant, around the 66% mark.
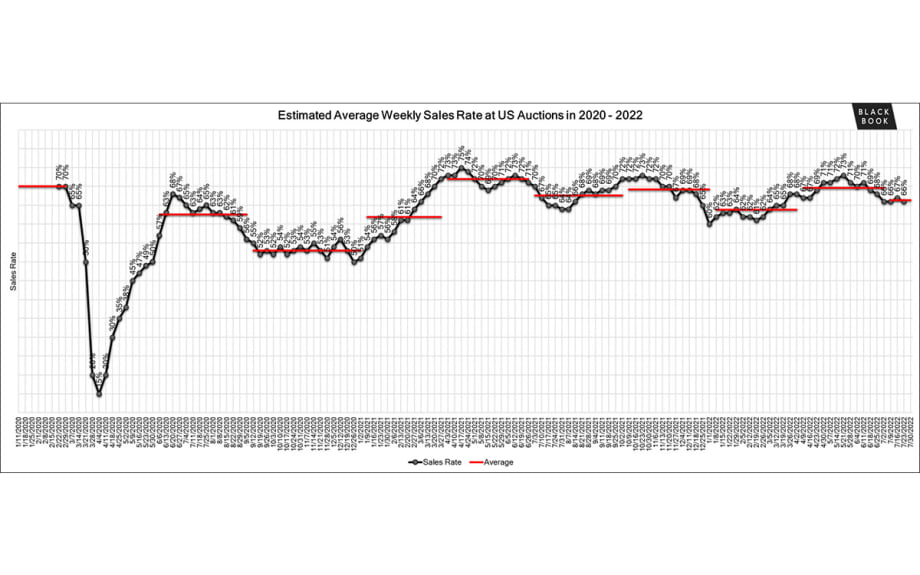
The Estimated Average Weekly Sales Rate remains somewhat stagnant, around the 66% mark.
Black Book Market Insights
Wholesale Prices, Week Ending July 23rd
Declines continued last week across most of our reporting segments. Full-Size Vans were the surprise of the week, experiencing their first true signs of softening after seventy-seven weeks of increases and/or very minimal declines with a decline of -0.55%, compared to the average weekly increase over the last seventy-seven weeks of +0.52%.
This Week Last Week 2017-2019 Average (Same Week)
Car segments -0.45% -0.47% -0.29%
Truck & SUV segments -0.48% -0.44% -0.22%
Market -0.47% -0.45% -0.25%
Car Segments
On a volume-weighted basis, the overall Car segment decreased -0.45%. For reference, the previous week, cars decreased by -0.47%.
All nine Car segments decreased last week.
Sub-Compact Car has been declining in recent weeks, but the declines are continuing to be significantly less than the other Car segments. Last week, the segment only declined -0.07%, compared to the -0.45% overall Car segment decline.
Luxury Car increased the rate of declines last week, depreciating -0.82% compared to the prior week’s already large decline of -0.50%.
Sporty Car (-0.63%), Near Luxury Car (-0.62%), Premium Sporty Car (-0.53%), and Prestige Luxury Car (-0.51%) also had large declines that were larger than their respective prior week changes.
Truck / SUV Segments
The volume-weighted, overall Truck segment decreased -0.48%, compared to the prior week’s decrease of -0.44%.
Twelve out of the thirteen truck segments reported decreases.
Full-Size Vans experienced the first true signs of softening with a decline of -0.55% last week. This comes after seventy-seven weeks of increases and/or stability that accounted for an average weekly increase of +0.52%.
Full-Size luxury Crossovers declined the most for trucks, down -1.31%. This now makes for twenty-eight consecutive weeks of depreciation with an average weekly decline of -0.48%.
Weekly Wholesale Index
Calendar year 2020 and 2021 ended with used wholesale prices at elevated levels. With economic patterns (including the automotive market) driven by the pandemic, normal seasonal patterns (e.g., 2019 calendar year) in the wholesale market were not observed for most of the last 2 years. We saw a similar picture in 2009, at the end of the Great Recession. Calendar year 2021 did not have typical seasonality patterns as the market had rapid increases in wholesale values for the majority of the year. The Wholesale Weekly Price Index reached the highest point of the year at the end of December 2021, reporting over 1.51 points. Throughout 2022, the Index has remained stable compared to the beginning of the year.
The graph below looks at trends in wholesale prices of 2-6-year-old vehicles, indexed to the first week of the year. The index is computed keeping the average age of the mix constant to identify market movements.
Retail (Used and New) Insights
Amazon recently unveiled road-ready Rivian EDVs at a last-mile delivery center; these custom electric delivery vehicles will be used in Baltimore, Chicago, Dallas, Kansas City, Nashville, Phoenix, San Diego, Seattle and St. Louis, among other cities.
General Motors and Nissan N.A. are competing for the Artemis contract to power NASA’s lunar rover.
Porsche confirms plans for a sporty range-topping full-electric crossover positioned above the Cayenne and Macan; currently codenamed K1, the vehicle is slated to arrive in the second half of the decade and may offer three rows of seating.
Volkswagen revealed that Scott Keogh will lead the Scout electric truck and SUV brand – vehicles are expected to arrive in 2026.
Tesla CEO, Elon Musk, advised analysts and investors that they anticipate Cybertruck deliveries by mid-2023.
Used Retail Prices
Used Retail Prices are more accessible than in years past, due to the proliferation of ‘no-haggle pricing’ for used-vehicle retailing. Transparent pricing upfront makes the car buying process more enjoyable for customers and allows Black Book to accurately measure retail market trends.
At the on-set of the pandemic, in CY2020, used retail prices increased slightly, following typical seasonal patterns, and then began dropping in April, finally hitting a low point in the late spring months. By late summer of CY2020, Used Retail Prices increased as supply of new vehicle inventory started to become scarce, but retail demand slowed down at the end of CY2020, resulting in declining retail asking prices for the last several weeks of the year. When CY2021 kicked off, demand rebounded while retail prices lagged slightly behind wholesale prices; March of 2021 started the dramatic increases in Used Retail Prices, fueled by stimulus payments, tax season, and shortages of new inventory. During the third quarter, retail prices continued to rise at a slower rate but soon picked up the pace once again to start the fourth quarter. In Q4, prices on retail listings steadily increased week after week. As CY2021 came to an end, the retail listing price index closed 36% above where the year began.
So far in 2022, the Retail Listings Price Index has remained relatively unchanged. The Index sits around 0.99, indicating a very slight decrease in retail pricing compared to the start of the year. Typically, there is a lag between changes in wholesale prices and retail prices.
This analysis is based on approximately two million vehicles listed for sale on U.S. dealer lots. The graph below looks at 2-6-year-old vehicles. The Index is computed keeping the average age of the mix constant to identify market movements.
Inventory
Used Retail
Used Retail Listing Volume has declined slightly and is back to where the year started.
The Used Retail Days-to-Turn Estimate has also increased and now sits around 41 days.
Wholesale
The wholesale channels remained fairly consistent last week, with very few model year 2022 vehicles. Older model years (model year 2017 to model year 2019) were offered in the lanes but they many are lower quality with higher mileage than normally expected. Buyers were still very active in the lanes and sellers tended to be more open to negotiation. Floors are continuing to soften, which may be an indicator that sellers are hopeful about new inventory coming. Overall, fuel prices for both gas and diesel decreased last week. Continuing the trend, all car segment wholesale values decreased last week. Luxury cars led the pack in the declines, followed by Sporty Car and Near Luxury Car segments. In the Truck segments, Full Size Luxury Crossovers decreased the most. Even Full-Size Vans took a turn and are finally showing signs of softening.
The Estimated Average Weekly Sales Rate remains somewhat stagnant, around the 66% mark.
Originally posted on F&I and Showroom
Auto loan originations rose over 6% year-over-year in the third quarter of 2025, but TransUnion predicts a slight decline in auto loan growth this year, making it an outlier in the company's overall lending forecast.
Read More →
Growing access shows greater lender appetite for risk as consumers take on heavier debt burden in an inflated market.
Read More →
Data reflect growing finance activity on the extreme ends of credit risk scale
Read More →
The amounts owed on under-water trade-ins reach new highs.
Read More →
Recent patterns show good credit helps navigate high interest rates as highly leveraged consumers sink further.
Read More →
Slight May improvement came with risks to borrowers, lenders.
Read More →Experian report shows other shifts, including banks clawing back market share.
Read More →
Overall April conditions didn’t benefit the consumer, especially those presenting more risk.
Read More →