EV Surge Shows AI Steadied Softer Q3
StoneEagleData reveals the gross reality behind the rise in EV leasing and the steady role F&I offices played.


StoneEagle’s F&I Benchmark Report tracks third-quarter dealer performance and product trends.
StoneEagle/ADT
Finance-and-insurance provider StoneEagle released its third-quarter StoneEagleData F&I Benchmark Report, which tracks deal performance across more than half of the automotive retail market.
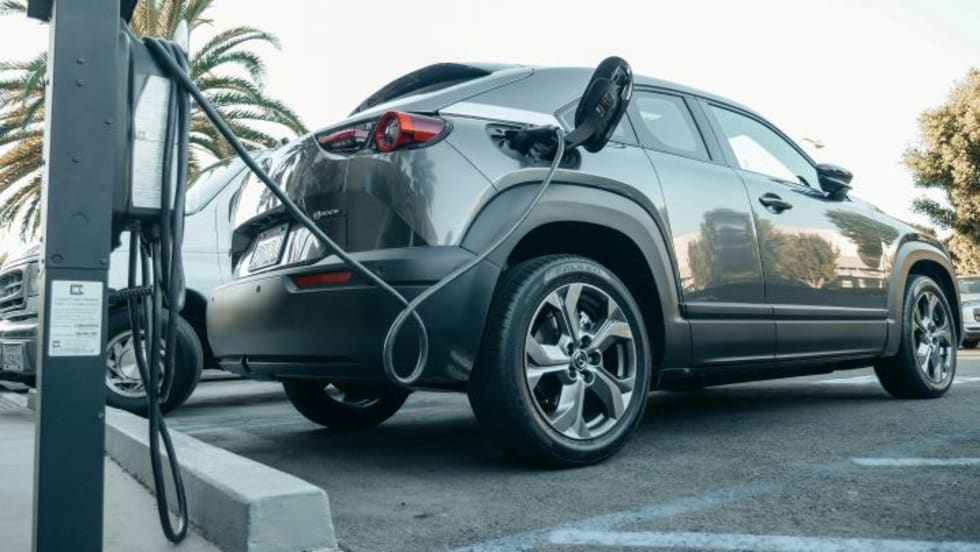
The report found electric vehicles accounted for about 6% of franchised dealer transactions in the third quarter. Nearly 60% of EV deals were leases, reflecting how dealers continued to use leasing to support affordability during the final months of the federal EV tax credit.
Total gross per deal also trended lower, driven by a sharp drop in front gross as dealers discounted vehicles to close deals.
“EVs drew a lot of attention this period, but they were only a small slice of what we measured,” said StoneEagle CEO Cindy Allen. “The data shows dealers leaned on leasing to help consumers into EVs, while consistent F&I revenue helped offset softer front-end results.”
Third-Quarter Highlights
Results showed steady F&I performance across key metrics. Deal counts rose nearly 3% year-over-year, and total F&I income per dealer increased almost 12%. F&I profit per vehicle retailed increased 8% year-over-year, while average products per deal rose 2.5%. Those gains helped limit total gross per deal to a 2.1% decline despite a 26% drop in front gross year-over-year.
F&I profit per vehicle retailed: Averaged $1,933 per deal, up from $1,923 in the second quarter and $1,786 a year earlier
Products per deal: Averaged 1.56 products compared with 1.57 in the second quarter and 1.52 a year earlier
Average monthly F&I income per dealer: $222,677, up from $219,266 in the second quarter and $199,876 a year earlier
Average front gross: $560 per vehicle, down from $839 in the second quarter and $761 a year earlier but still roughly 30% above pre-COVID levels.
Total gross per vehicle: Averaged $2,493, down from $2,762 in the second quarter and $2,547 a year earlier
Product Performance, Mix
Product performance was steady, with service contracts and gap coverage continuing to anchor F&I revenue. Ancillary offerings held at roughly one-third of product-driven F&I revenue. Overall, product sales represented just over 60% of total F&I revenue for the quarter.
Vehicle service contracts: Held steady at 44% penetration compared with 45% in the second quarter and 44% a year earlier
Guaranteed Asset Protection: Reached 38%, consistent with the second quarter and up from 36% a year earlier
Paint-and-fabric protection: Averaged 20%, up from 19% a year earlier
Prepaid maintenance: Held at 16%, unchanged from both the second quarter and a year earlier
Tire-and-wheel protection: Averaged 10%, matching both the second quarter and a year earlier
“F&I product providers continue to refine their offerings, and we’re seeing that show up in the data,” said Colin Snyder, general manager of StoneEagle’s Automotive Retail Solutions. “The data points to continued interest in bundled product and appearance packages when they’re presented clearly and consistently.”
Originally posted on Auto Dealer Today
More Industry
World EV Adoption Set to Grow
A new report says the segment, despite recent setbacks in some regions, is poised for acceleration as many countries look to reduce pollution.
Read More →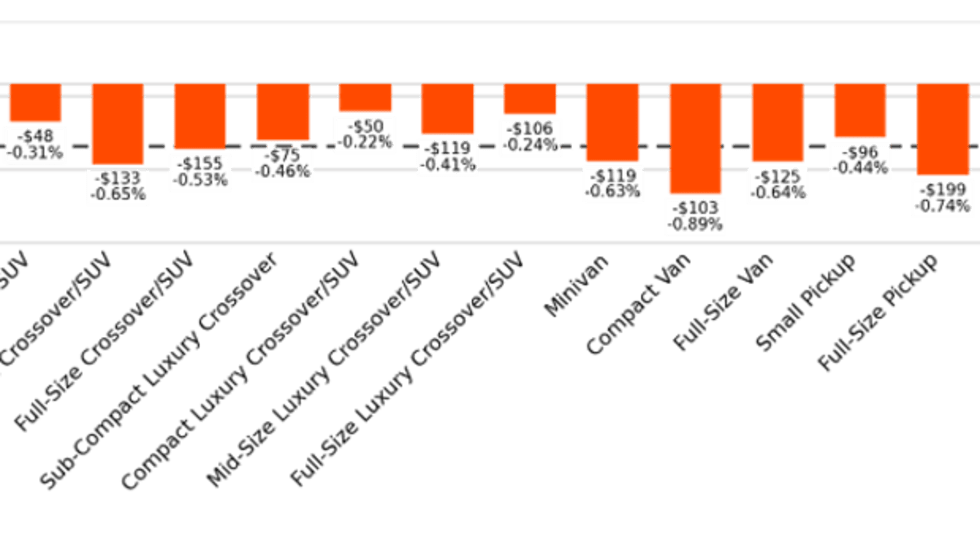
Black Book: Weekly Market Update
Wholesale automotive auction business stayed steady last week as bidders encountered lower prices, analysts observed.
Read More →
Pricing Transparency Drives Purchase Consideration
An annual study by JD Power found that clear pricing matters to consumers on automaker websites, so much so that it increases their purchase consideration.
Read More →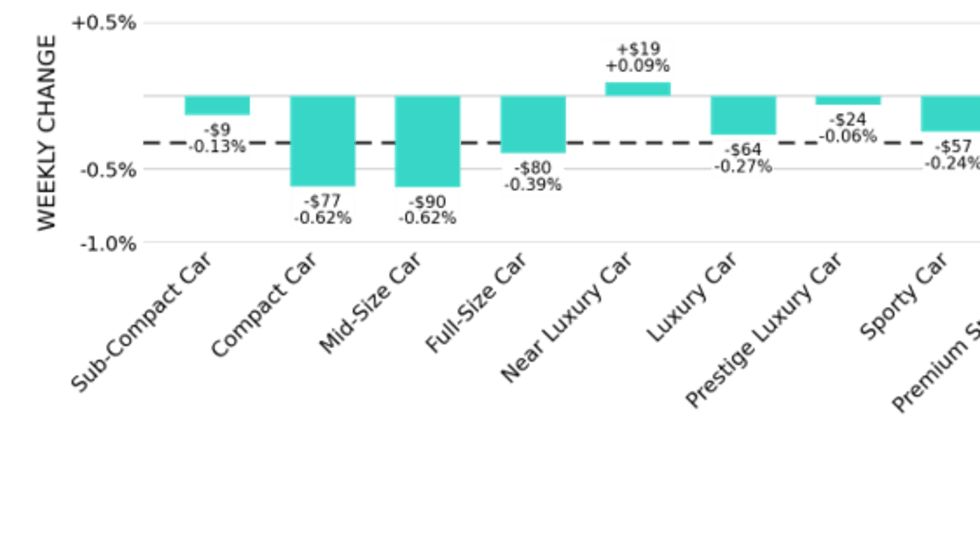
Black Book: Weekly Market Update
Used-vehicle market depreciation was the prevailing story in the wholesale market last week.
Read More →
Smaller Is Looking Better
A growing number of Americans in the market for a new vehicle are opting for more affordable options, not waiting for market stability to bite the bullet.
Read More →
U.S. EV Market Slowly Stabilizes
U.S. electric-vehicle interest is slowly stabilizing since a major dip in sales after last year's end of the federal EV tax credit, and hybrids remain the leading electrified power train.
Read More →
Global EV Market Entering New Phase
Automakers are making investments to lower battery costs and optimize production to meet changing consumer needs.
Read More →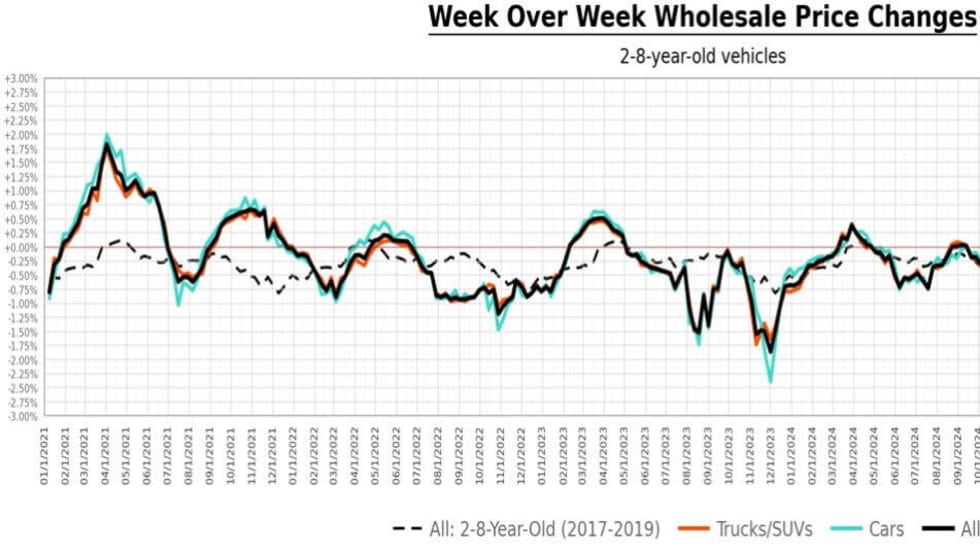
Black Book Weekly Market Update
The holiday weekend, not surprisingly, put a drag on wholesale automotive activity last week, analysts observed.
Read More →
Auto Affordability in Context
Cox Automotive points out the complex circumstances that have led to eye-popping vehicle prices.
Read More →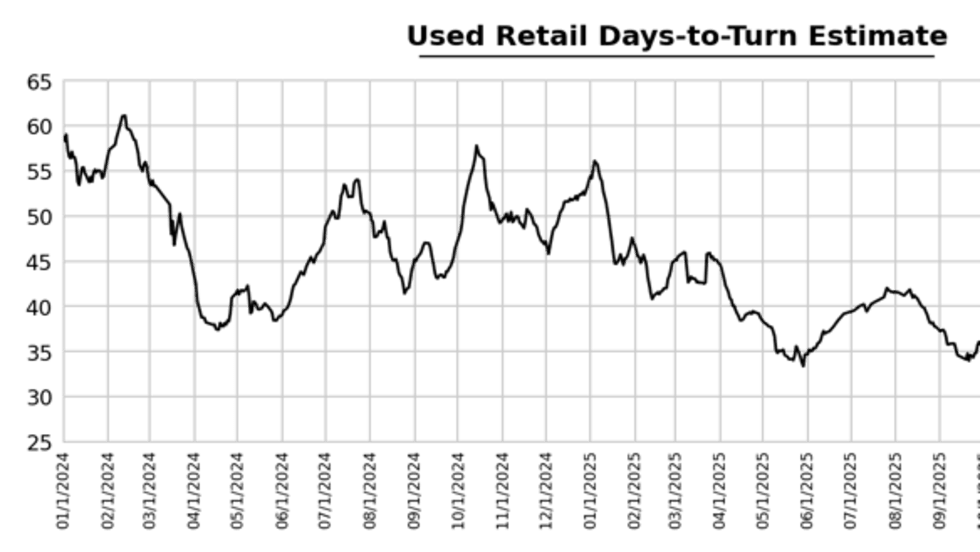
Black Book: Weekly Market Update
Automotive auction inventory increased last week, giving choosy bidders even more leeway.
Read More →